What Are the Digital Humanities?

Introduction

As new technology has revolutionized the ways all fields gather information, scholars have integrated the use of digital software to enhance traditional models of research. While digital software may seem only relevant in scientific research, digital projects play a crucial role in disciplines not traditionally associated with computer science. One of the biggest digital initiatives actually takes place in fields such as English, History, Philosophy, and more in what is known as the digital humanities. The digital humanities are an innovative way to incorporate digital data and computer science within the confines of humanities-based research. Although some aspects of the digital humanities are exclusive to specific fields, most digital humanities projects are interdisciplinary in nature. Below are three general impacts that projects within the digital humanities have enhanced the approaches to humanities research for scholars in these fields.

Digital Access to Resources

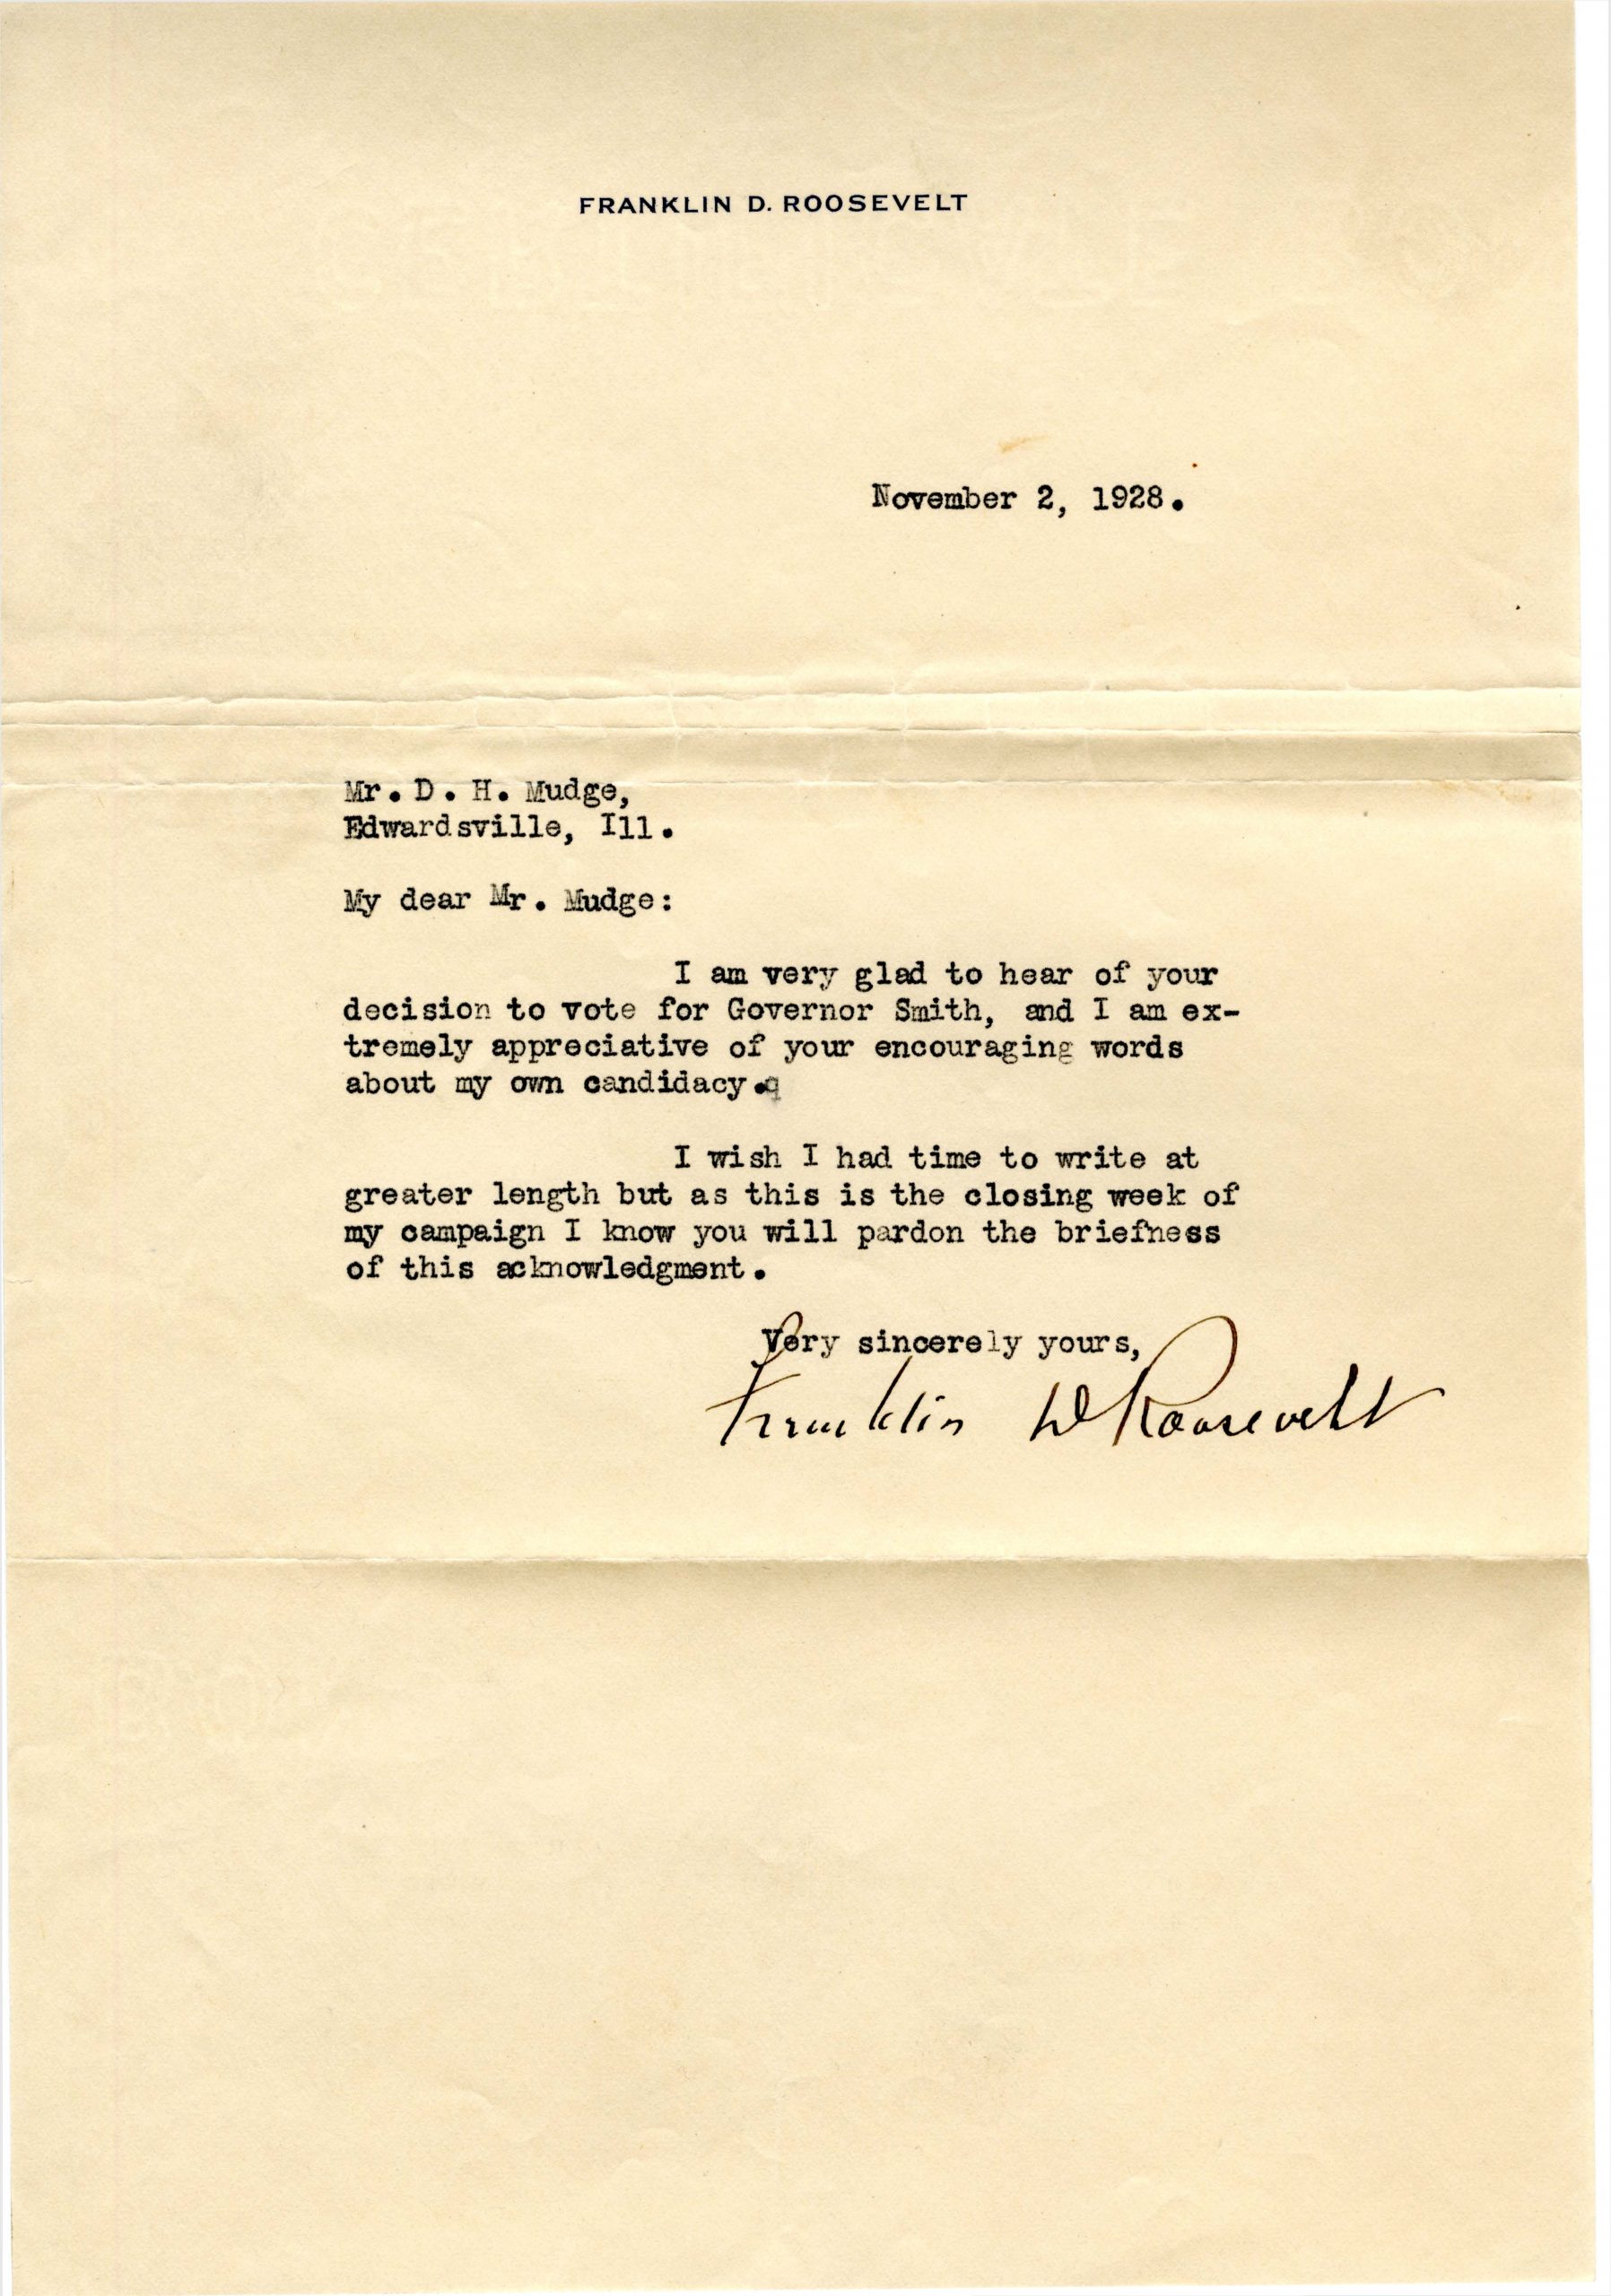
Digital access is a way of taking items necessary for humanities research and creating a system where users can easily access these resources. This work involves digitizing physical items and formatting them to store them on a database that permits access to its contents. Since some of these databases may hold thousands or millions of items, digital humanists also work to find ways so that users may locate these specific items quickly and easily. Thus, digital access requires both the digitization of physical items and their storage on a database as well as creating a path for scholars to find them for research purposes.

Providing Tools to Enhance Interpretation of Data and Sources

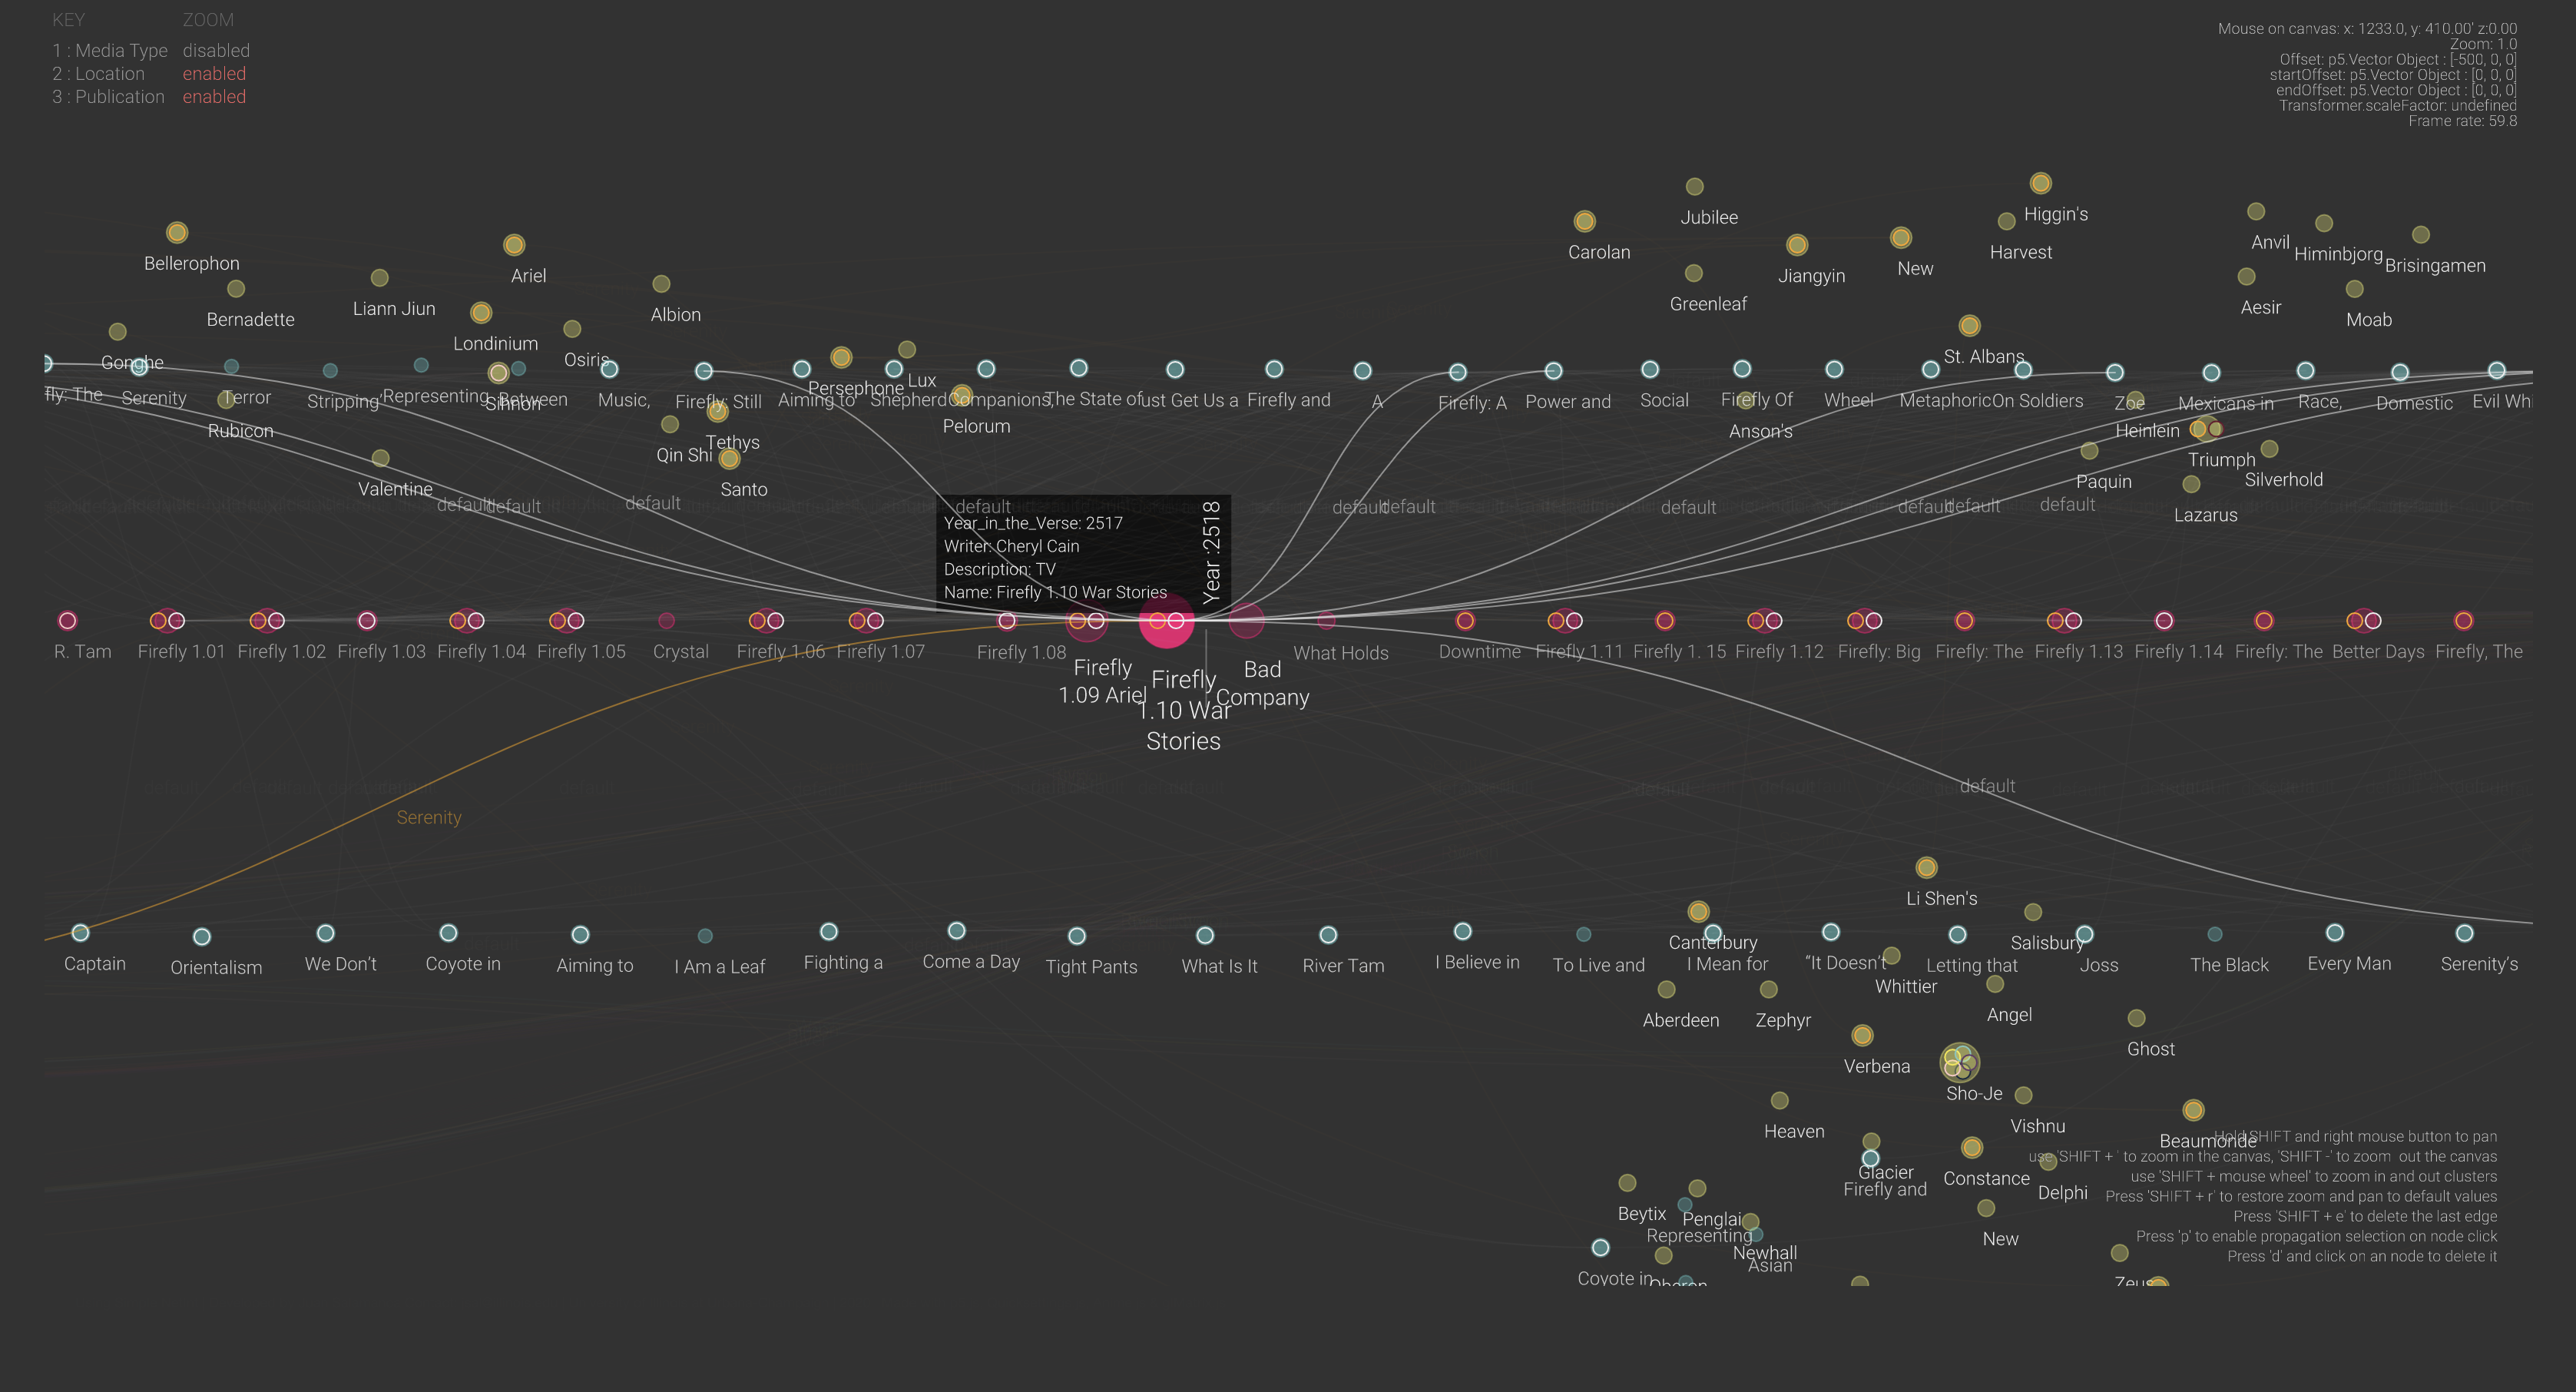
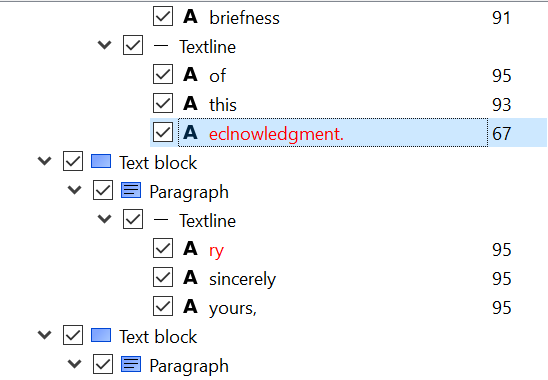
The digital humanities can also change how we can interpret sources and other items used in the digital humanities. Data Visualization software, for example, helps simplify large, complex datasets and presents this data in ways more visually appealing. Likewise, text mining software uncovers trends through analyzing text that potentially saves hours or even days for digital humanists had they analyzed the text through analog methods. Finally, Geographic Information Systems (GIS) software allows for users working on humanities projects to create special types of maps that can both assist in visualizing and analyzing data. These software programs and more have dramatically transformed the ways digital humanists interpret and visualize their research.

Digital Publishing

The digital humanities have opened new opportunities for scholars to publish their work. In some cases, digital publishing is simply digitizing an article or item in print to expand the reach of a given publication to readers who may not have direct access to the physical version. Other times, some digital publishing initiatives publish research that is only accessible in a digital format. One benefit to digital publishing is that it opens more opportunities for scholars to publish their research and expands the audience for their research than just publishing in print. As a result, the digital humanities provide scholars more opportunities to publish their research while also expanding the reach of their publications.

How Can I Learn More About the Digital Humanities?

There are many ways to get involved both at the University of Illinois as well as around the globe. Here is just a list of a few examples that can help you get started on your own digital humanities project:

  • HathiTrust is a partnership through the Big Ten Academic Alliance that holds over 17 million items in its collection.
  • Internet Archive is a public, multimedia database that allows for open access to a wide range of materials.
  • The Scholarly Commons page on the digital humanities offers many of the tools used for data visualization, text mining, GIS software, and other resources that enhance analysis within a humanities project. There are also a couple of upcoming Savvy Researcher workshops that will go over how to use software used in the digital humanities
  • Sourcelab is an initiative through the History Department that works to publish and preserve digital history projects. Many other humanities fields have equivalents to Sourcelab that serves the specific needs of a given discipline.

Introductions: What is Digital Scholarship, anyways?

This is the beginning of a new series where we introduce you to the various topics that we cover in the Scholarly Commons. Maybe you’re new to the field or you’re just to the point where you’re just too afraid to ask… Fear not! We are here to take it back to the basics!

What is digital scholarship, anyways?

Digital scholarship is an all-encompassing term and it can be used very broadly. Digital scholarship refers to the use of digital tools, methods, evidence, or any other digital materials to complete a scholarly project. So, if you are using digital means to construct, analyze, or present your research, you’re doing digital scholarship!

It seems really basic to say that digital scholarship is any project that uses digital means because nowadays, isn’t that every project? Yes and No. We use the term digital quite liberally…If you used Microsoft Word to just write your essay about a lab you did during class – that is not digital scholarship however if you used specialized software to analyze the results from a survey you used to gather data then you wrote about it in an essay that you then typed in Microsoft Word, then that is digital scholarship! If you then wanted to get this essay published and hosted in an online repository so that other researchers can find your essay, then that is digital scholarship too!

Many higher education institutions have digital scholarship centers at their campus that focus on providing specialized support for these types of projects. The Scholarly Commons is a digital scholarship space in the University Main Library! Digital scholarship centers are often pushing for new and innovative means of discovery. They have access to specialized software and hardware and provide a space for collaboration and consultations with subject experts that can help you achieve your project goals.

At the Scholarly Commons, we support a wide array of topics that support digital and data-driven scholarship that this series will cover in the future. We have established partners throughout the library and across the wider University campus to support students, staff, and faculty in their digital scholarship endeavors.

Here is a list of the digital scholarship service points we support:

You can find a list of all the software the Scholarly Commons has to support digital scholarship here and a list of the Scholarly Commons hardware here. If you’re interested in learning more about the foundations of digital scholarship follow along to our Introductions series as we got back to the basics.

As always, if you’re interested in learning more about digital scholarship and how to  support your own projects you can fill out a consultation request form, attend a Savvy Researcher Workshop, Live Chat with us on Ask a Librarian, or send us an email. We are always happy to help!

Simple NetInt: A New Data Visualization Tool from Illinois Assistant Professor, Juan Salamanca

Juan Salamanca Ph.D, Assistant Professor in the School of Art and Design at the University of Illinois Urbana-Champaign recently created a new data visualization tool called Simple NetInt. Though developed from a tool he created a few years ago, this tool brings entirely new opportunities to digital scholarship! This week we had the chance to talk to Juan about this new tool in data visualization. Here’s what he said…

Simple NetInt is a JavaScript version of NetInt, a Java-based node-link visualization prototype designed to support the visual discovery of patterns across large dataset by displaying disjoint clusters of vertices that could be filtered, zoomed in or drilled down interactively. The visualization strategy used in Simple NetInt is to place clustered nodes in independent 3D spaces and draw links between nodes across multiple spaces. The result is a simple graphic user interface that enables visual depth as an intuitive dimension for data exploration.

Simple NetInt InterfaceCheck out the Simple NetInt tool here!

In collaboration with Professor Eric Benson, Salamanca tested a prototype of Simple NetInt with a dataset about academic publications, episodes, and story locations of the Sci-Fi TV series Firefly. The tool shows a network of research relationships between these three sets of entities similar to a citation map but on a timeline following the episodes chronology.

What inspired you to create this new tool?

This tool is an extension of a prototype I built five years ago for the visualization of financial transactions between bank clients. It is a software to visualize networks based on the representation of entities and their relationships and nodes and edges. This new version is used for the visualization of a totally different dataset:  scholarly work published in papers, episodes of a TV Series, and the narrative of the series itself. So, the network representation portrays relationships between journal articles, episode scripts, and fictional characters. I am also using it to design a large mural for the Siebel Center for Design.

What are your hopes for the future use of this project?

The final goal of this project is to develop an augmented reality visualization of networks to be used in the field of digital humanities. This proof of concept shows that scholars in the humanities come across datasets with different dimensional systems that might not be compatible across them. For instance, a timeline of scholarly publications may encompass 10 or 15 years, but the content of what is been discussed in that body of work may encompass centuries of history. Therefore, these two different temporal dimensions need to be represented in such a way that helps scholars in their interpretations. I believe that an immersive visualization may drive new questions for researchers or convey new findings to the public.

What were the major challenges that came with creating this tool?

The major challenge was to find a way to represent three different systems of coordinates in the same space. The tool has a universal space that contains relative subspaces for each dataset loaded. So, the nodes instantiated from each dataset are positioned in their own coordinate system, which could be a timeline, a position relative to a map, or just clusters by proximities. But the edges that connect nodes jump from one coordinate system to the other. This creates the idea of a system of nested spaces that works well with few subspaces, but I am still figuring out what is the most intuitive way to navigate larger multidimensional spaces.

What are your own research interests and how does this project support those?

My research focuses on understanding how designed artifacts affect the viscosity of social action. What I do is to investigate how the design of artifacts facilitates or hinders the cooperation of collaboration between people. I use visual analytics methods to conduct my research so the analysis of networks is an essential tool. I have built several custom-made tools for the observation of the interaction between people and things, and this is one of them.

If you would like to learn more about Simple NetInt you can find contact information for Professor Juan Salamanca here and more information on his research!

If you’re interested in learning more about data visualizations for your own projects, check out our guide on visualizing your data, attend a Savvy Researcher Workshop, Live Chat with us on Ask a Librarian, or send us an email. We are always happy to help!

Free, Open Source Optical Character Recognition with gImageReader

Optical Character Recognition (OCR) is a powerful tool to transform scanned, static images of text into machine-readable data, making it possible to search, edit, and analyze text. If you’re using OCR, chances are you’re working with either ABBYY FineReader or Adobe Acrobat Pro. However, both ABBYY and Acrobat are propriety software with a steep price tag, and while they are both available in the Scholarly Commons, you may want to perform OCR beyond your time at the University of Illinois.

Thankfully, there’s a free, open source alternative for OCR: Tesseract. By itself, Tesseract only works through the command line, which creates a steep learning curve for those unaccustomed to working with a command-line interface (CLI). Additionally, it is fairly difficult to transform a jpg into a searchable PDF with Tesseract.

Thankfully, there are many free, open source programs that provide Tesseract with a graphical user interface (GUI), which not only makes Tesseract much easier to use, some of them come with layout editors that make it possible to create searchable PDFs. You can see the full list of programs on this page.

The program logo for gImageReader

The program logo for gImageReader

In this post, I will focus on one of these programs, gImageReader, but as you can see on that page, there are many options available on multiple operating systems. I tried all of the Windows-compatible programs and decided that gImageReader was the closest to what I was looking for, a free alternative to ABBYY FineReader that does a pretty good job of letting you correct OCR mistakes and exporting to a searchable PDF.

Installation

gImageReader is available for Windows and Linux. Though they do not include a Mac compatible version in the list of releases, it may be possible to get it to work if you use a package manager for Mac such as Homebrew. I have not tested this though, so I do not make any guarantees about how possible it is to get a working version of gImageReader on Mac.

To install gImageReader on Windows, go to the releases page on Windows. From there, go to the most recent release of the program at the top and click Assets to expand the list of files included with the release. Then select the file that has the .exe extension to download it. You can then run that file to install the program.

Manual

The installation of gImageReader comes with a manual as an HTML file that can be opened by any browser. As of the date of this post, the Fossies software archive is hosting the manual on its website.

Setting OCR Mode

gImageReader has two OCR modes: “Plain Text” and “hOCR, PDF”. Plain Text is the default mode and only recognizes the text itself without any formatting or layout detection. You can export this to a text file or copy and paste it into another program. This may be useful in some cases, but if you want to export a searchable PDF, you will need to use hOCR, PDF mode. hOCR is a standard for formatting OCR text using either XML or HTML and includes layout information, font, OCR result confidence, and other formatting information.

To set the recognition to hOCR, PDF mode, go to the toolbar at the top. It includes a section for “OCR mode” with a dropdown menu. From there, click the dropdown and select hOCR, PDF:

gImageReader Toolbar

This is the toolbar for gImageReader. You can set OCR mode by using the dropdown that is the third option from the right.

Adding Images, Performing Recognition, and Setting Language

If you have images already scanned, you can add them to be recognized by clicking the Add Images button on the left panel, which looks like a folder. You can then select multiple images if you want to create a multipage PDF. You can always add more images later by clicking that folder button again.

On that left panel, you can also click the Acquire tab button, which allows you to get images directly from a scanner, if the computer you’re using has a scanner connected.

Once you have the images you want, click the Recognize button to recognize the text on the page. Please note that if you have multiple images added, you’ll need to click this button for every page.

If you want to perform recognition on a language other than English, click the arrow next to Recognize. You’ll need to have that language installed, but you can install additional languages by clicking “Manage Languages” in the dropdown appears. If the language is already installed, you can go to the first option listed in the dropdown to select a different language.

Viewing the OCR Result

In this example, I will be performing OCR on this letter by Franklin D. Roosevelt:

Raw scanned image of a typewritten letter signed by Franklin Roosevelt

This 1928 letter from Franklin D. Roosevelt to D. H. Mudge Sr. is courtesy of Madison Historical: The Online Encyclopedia and Digital Archive for Madison County Illinois. https://madison-historical.siue.edu/archive/items/show/819

Once you’ve performed OCR, there will be an output panel on the right. There are a series of buttons above the result. Click the button on the far right to view the text result overlaid on top of the image:

The text result of performing OCR on the FDR letter overlaid on the original scan.

Here is the the text overlaid on an image of the original scan. Note how the scan is slightly transparent now to make the text easier to read.

Correcting OCR

The OCR process did a pretty good job with this example, but it there are a handful of errors. You can click on any of the words of text to show them on the right panel. I will click on the “eclnowledgment” at the end of the letter to correct it. It will then jump to that part of the hOCR “tree” on the right:

hOCR tree in gImageReader, which shows the recognition result of each word in a tree-like structure.

The hOCR tree in gImageReader, which also shows OCR result.

Note in this screenshot I have clicked the second button from the right to show the confidence values, where the higher the number, the higher the confidence Tesseract has with the result. In this case, it is 67% sure that eclnowledgement is correct. Since it obviously isn’t correct, we can type new text by double-clicking on the word in this panel and type “acknowledgement.” You can do this for any errors on the page.

Other correction tips:

  1. If there are any regions that are not text that it is still recognizing, you can right click them on the right and delete them.
  2. You can change the recognized font and its size by going to the bottom area labeled “Properties.” Font size is controlled by the x_fsize field, and x_font has a dropdown where you can select a font.
  3. It is also possible to change the area of the blue word box once it is selected, simply by clicking and dragging the edges and corners.
  4. If there is an area of text that was not captured by the recognition, you can also right click in the hOCR “tree” to add text blocks, paragraphs, textlines, and words to the document. This allows you to draw a box on image and then type what the text says.

Exporting to PDF

Once you are done making OCR corrections, you can export to a searchable PDF. To do so, click the Export button above the hOCR “tree,” which is the third button from the left. Then, select export to PDF. It then gives you several options to set the compression and quality of the PDF image, and once you click OK, it should export the PDF.

Conclusion

Unfortunately, there are some limitations to gImageViewer, as can often be the case with free, open source software. Here are some potential problems you may have with this program:

  1. While you can add new areas to recognize with OCR, there is not a way to change the order of these elements inside the hOCR “tree,” which could be an issue if you are trying to make the reading order clear for accessibility reasons. One potential workaround could be to use the Reading Order options on Adobe Acrobat, which you can read about in this libguide.
  2. You cannot show the areas of the document that are in a recognition box unless you click on a word, unlike ABBYY FineReader which shows all recognition areas at once on the original image.
  3. You cannot perform recognition on all pages at once. You have to click the recognition button individually for each page.
  4. Though there are some image correction options to improve OCR, such as brightness, contrast, and rotation, it does not have as many options as ABBYY FineReader.

gImageViewer is not nearly as user friendly or have all of the features that ABBYY FineReader has, so you will probably want to use ABBYY if it is available to you. However, I find gImageViewer a pretty good program that can meet most general OCR needs.

Illinois Digital Humanities Projects That Will Blow Your Mind

We are living in a moment where we get to discover the exciting possibilities of working, learning, and sharing on digital formats. I have decided to use this as an opportunity to appreciate the ways in which others have already embraced the power digital platforms to enhance their research. In this post I will highlight three amazing digital humanities projects that researchers right here at the University of Illinois contributed to. For each project I will provide a link to their official web page, a brief description of the project, and the name and department of the UIUC researcher who contributed to this project. Prepare to be wowed by the amazing digital work to have come out of our University research community.

Owen Wilson mouthing the word wow

“Prepare to be wowed”- Owen Wilson

Continue reading