Graduation Interview with our Graduate Assistants

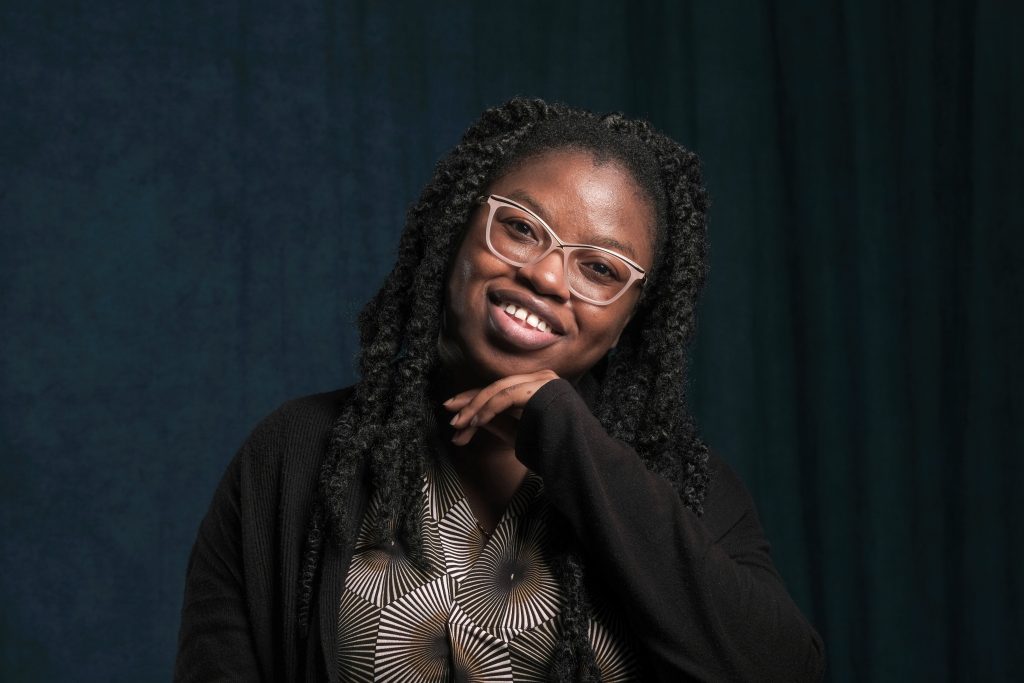
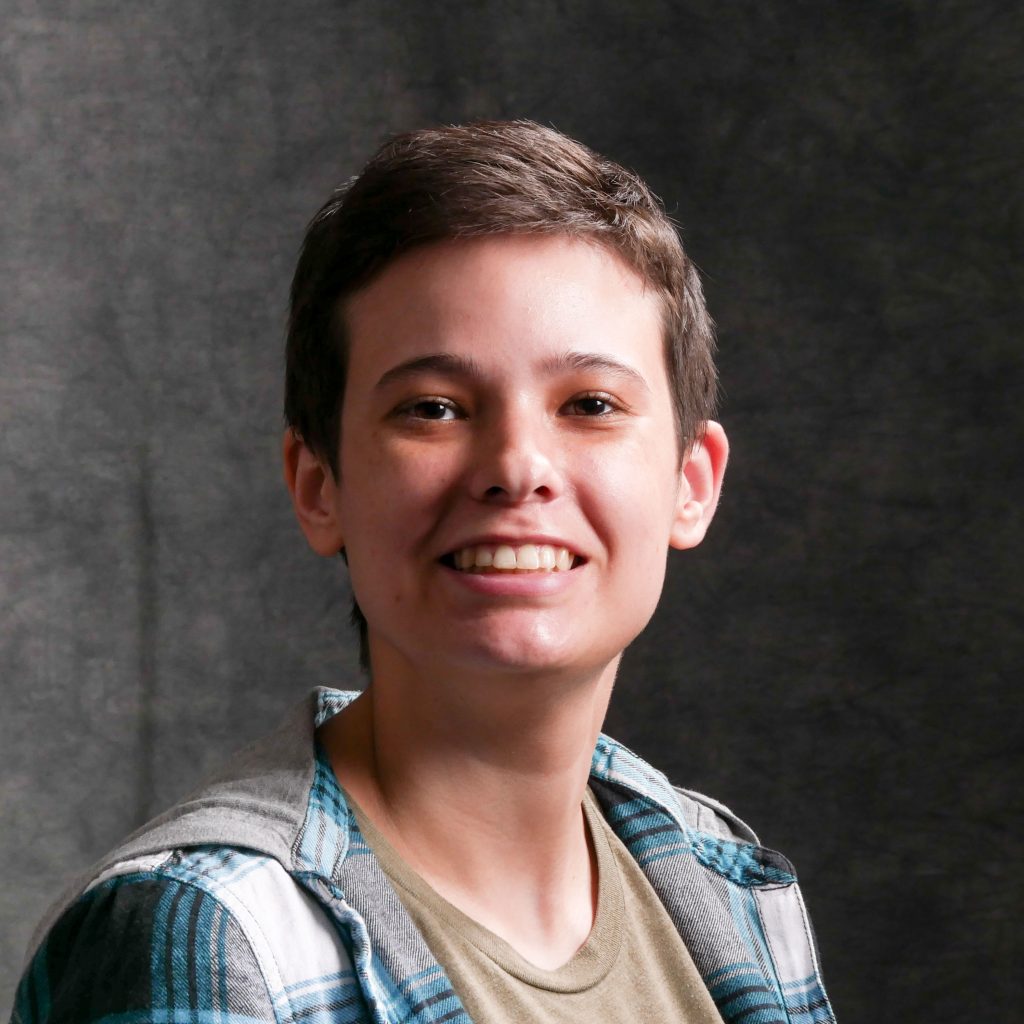
It is the end of the Spring Semester, and for everyone in their final semester, it means Graduation! That is certainly what it means for three of our graduate assistants at the Scholarly Commons. While it is a bittersweet moment for us at the Scholarly Commons to see our colleagues go, we are happy and excited about the great things they will achieve in their chosen profession.  This week, we interviewed three of our graduating graduate assistants Zhaneille Green, Ryan Yoakum and Nora Davies who have been a major asset to the Scholarly Commons. Over the past two years they have added immeasurable value to our department and in our interview with them, they all had amazing things to say about their experience at the Scholarly Commons. Here are some highlights from our interview with them.

How would you describe your GA experience to others?

Zhaneille: My experience has been eclectic. I joined the Scholarly Commons during a time of change, and it continues to evolve. I’ve learned so much about instruction, media, collection development, and service and service-point communication.

Ryan: My role comprises of three major parts. First, I am responsible for supervising both the Help Desk in room 220 as well as the Loanable Technology desk and ensuring that the student employees have everything they need to support the library patrons. Outside those desk hours, I am also responsible for designing workshops, supporting events hosted in the space, and hosting consultations related to optical character recognition and ABBYY FineReader. The third aspect of my work are internal projects related to the unit. Without going into specifics, these basically require me to have a basic understanding of data analysis and library policy creation.

Nora: I’d describe it as a great opportunity to get experience working in an academic library. I had a great team to work with and I truly wish that I could stay longer. I learned a lot about library services beyond my experience with public libraries and I had fun collaborating on projects with my fellow GA’s.

What accomplishments are you most proud of working with Scholarly Commons?

Zhaneille: I am most proud of the GIS (Geographic Information Science) Savvy Researcher workshops I taught with my GIS supervisor. It led to members of the University of Illinois community reaching out to learn more and allowed me and a fellow GA to take on big projects. I’m even getting experience with grant writing because of my GIS expertise.

Ryan: I am really proud of the Image of Research competitions during my two years with the Scholarly Commons. The students who have taken their time and effort to participate do a really great job each year, and it is incredibly rewarding to help out with this event each year. I am also really proud of the ways I have gotten to help others in the unit internally, whether it was designing the training session for the undergraduate student workers or assisting a full-time staff member on one of their projects. 

Nora: I’m proud of running a Savvy Researcher Workshop on Accessible E-Learning with Zhaneille. I was able to broaden my instruction experience and practice lesson planning and it was great to be able to share our knowledge with others.

What do you believe is the next step in your career path?

Zhaneille: After two years as a GA in an academic library, I don’t want to leave academic librarianship, for now. I will continue to pursue a career in technical services, specifically e-resources.

Ryan: I am currently looking into positions related to instruction and digital technology. These two aspects of librarianship have played a key role in my development, so those positions are the most appealing to me in the job market. In the long term, I would love to focus on something more administrative and policy base, as it is an aspect of librarianship that has just started to grow on me.

Nora: I’ll still be here during the summer, so I don’t have that next step quite figured out yet. I’m beginning to apply in earnest to jobs that begin in the Fall and, because of my experience, I have a lot of different places I could go. I’ll be looking for positions in Archives & Special Collections or Reference Services, with a focus on my technology skills. I don’t have any particular preference between Academic and Public Libraries and I have the experience to apply for both.

Do you have any advice for any GA starting out?

Zhaneille: Take a moment to learn about what the department and the wider university needs and have to offer. A graduate assistantship is rewarding because even though your projects and duties are a part of the job, you learn so much in the process. I’m graduating and still wish I had taken more LinkedIn courses or met more people.

Ryan: Do not be intimidated by all of the technology if that is brand new to you. There are so many opportunities to grow in the Scholarly Commons to learn these tools naturally. I would also encourage exploring aspects of librarianship you are interested in during your GA’ship. Since collaboration is a crucial aspect of our identity, there are so many opportunities to work with colleagues in other units related to areas of librarianship you are curious about, and the Scholarly Commons GA’ship gives you that flexibility to do that.

Nora: Don’t be afraid to check in with your supervisors. They’re there to help you succeed! If you feel lost on a project, need more work, or want to get experience working with something specific your supervisor should have some ideas.

There you have it guys!  While goodbyes are hard, it is a necessity to welcome new beginnings. We are glad to see how the Scholarly Commons have impacted the growth of our graduate assistants. We know they are all going to continue to make outstanding contributions and change in their future endeavors. We celebrate you Zhaneille, Ryan and Nora and Congratulations on your graduation!

Copyright and AI Technology

On March 16, 2023, the U.S. Copyright Office announced the beginning of a study to examine potential issues caused by the growing use of artificial intelligence to create new works. These issues include whether work created by AI technologies are eligible for copyright protection and the use of  generative AI. Generative AI are technologies that create expressive works by viewing a large amount of human-created creative content. The U.S. Copyright Office also announced that they will be holding four public virtual listening sessions in spring to address the future of AI and copyright in creative fields including visual works and music and sound recordings. 

What is Copyright?

According to the U.S. Copyright Office, copyright is “a type of intellectual property that protects original works of authorship as soon as an author fixes the work in a tangible form of expression”. To be considered an original work, the work must have a minimal degree of creativity. Everyone owns a copyright, as everyone has created their own original work whether through classes, work, or for fun. Copyright registration serves to protect the rights of the author. 

Who is an Author?

The term “author” which is used in both the Constitution and Copyright Act has historically been interpreted to only apply to humans. By this definition, works created solely by AI technology are not able to be copyrighted. The U.S. Copyright Office differentiates between works that are created using technology as an assisting device and works that use AI for the creative elements of the work. If AI is used for the creative elements of the work, but a human selects and arranges the work in a creative way, the work is copyrightable. If a human modifies a work created by AI, the human-modified aspects of the work are copyrightable.

Applications for registration of AI created works have already been sent to the U.S. Copyright Office. One of these applications was denied in 2018 because the content was entirely AI generated. In February 2023, a graphic novel which used AI-generated images was accepted for copyright, with the caveat that the individual images were not copyrightable. 

Applying for Copyright Protection 

To register for copyright protection for a piece of work created in part with the use of AI technology one should use the Standard Application for copyright registration. The registrant must disclose that AI technology was used and describe the extent of its use. The registrant must list the author and explain what aspects of the work were created by humans. AI technology and the companies that make it should not be listed under the “Author Created” field of the application. 

As AI technologies become used more frequently to create literary work, art and music, it will become more important to consider the growing copyright issues they create. To read the full policy statement from the U.S. Copyright Office about material generated by artificial intelligence go to https://www.govinfo.gov/content/pkg/FR-2023-03-16/pdf/2023-05321.pdf

Visualizing your love for data

This post is in celebration of the love data week between Feb-13-Feb 17, 2023. 

Analytics screen graph.
Photo by Luke Chesser on Unsplash 

What is Data visualization?  

For this author, it was love at first sight. Well, technically, it was love at first Visualization. So many say seeing is believing, and data visualization helps us accomplish that, especially at the rate at which data is increasing exponentially in our world. The truth is that data is everywhere, and for us to draw meaning from it, we need to present it in a clear and concise manner.  

Data visualization is the graphical representation of data. Data can be represented in various forms and shapes, such as maps, charts, infographics, graphs, heat maps, or sparklines. When data is presented through visual elements, it is easy to understand and analyze. It helps you to derive meaning from the data and make better decisions. Visualizing your data involves using certain tools; these tools help you fall more in love with data.  

Data Visualization tools are software that allow you to create graphical representations of your data.  

Here are some tools to help you get started. These have been selected based on their ease of use, features (such as capacity for large volumes of data), cost, and popularity.

  1. Data Wrapper: If you are just starting out with data Visualization and you are looking for a free tool to help you get started, Data wrapper is your plug. Data Wrapper is a beginner-friendly tool with a clean and intuitive user interface accessible online. It is straightforward to navigate and great for creating charts and maps that can be easily embedded into reports. It also allows you to upload your files in various formats such as CSV, .tsv, and .txt 

Pros: 

  • Great for beginners.
  • Free to use.
  • Accessible online tool.

Cons:  

  • It can be challenging to build complex charts. 
  • Limited features. 
  • Security is not guaranteed as it is an online tool.
  1. Infogram: If you are not super design-inclined, this visualization tool should be your best friend. It has an editor drag-and-drop feature that makes it super easy to create beautiful designs without having to worry about where you are with your design skills. Infographics, marketing reports, maps, social media posts, and many more are examples of what you can create with this powerful tool. In addition, your data output can be exported in various formats, such as. JPG, GIF, PNG, HTML, and . PDF.  

Pros:

  • Web-based. 
  • Drag-and-drop editor.
  • Easy to use.
  • Highly customizable.

Cons: 

  • Built-in data sources are limited.
  • Not suitable for complex visualization.
  1. Google charts: Google Charts is another free data visualization tool that is user-friendly and compatible with all browsers and platforms. If you like to play around with codes, then Google Charts provides you with that option. Google Charts are coded with SVG and HTML5, allowing it to produce several graphic and pictorial data visualizations, ranging from simple visualization such as pie charts, bars, charts, histograms, maps, and scatter graphs to more complex ones such as hierarchical tree maps, timelines, and gauges. Google fusion tables, spreadsheets, and SQL databases are examples of data sources that can be used with Google Charts.  

Pros:

  • It is free.
  • It is compatible with various browsers.
  • Compatible with google products.

Cons:

  • Technical support is limited.
  • It requires network connectivity for visualization. 
  • There is no room for customization. 
  1. Tableau: This is one of the most popular data visualization tools, mainly because of the free public version that this software provides. Tableau provides the option of a desktop app, server, and online versions. In addition, this software has several data importation options, such as CSV files for google ads. Similarly, if you are looking into presenting your data in various formats, such as multiple chart formats and mapping, then Tableau is the one for you.  

Pros:

  • Provides several options for data import. 
  • It is available for free (public version).

Cons:

  • Lack of Privacy in the public version. 
  • Paid versions are costly. 

5. Dundas BI: Although this is one of the oldest data visualization tools, it is still standing strong as one of the most powerful tools for visualizing data with interactive charts, tree maps, gauges, smart tables, and scorecards. This interactivity allows users to understand the data quickly. Dundas BI is also highly customizable. Dundas BI operates on the ground of responsive HTML5 web technology that allows users to connect, analyze and interact with their data on any device. This powerful tool also provides a built-in feature for extracting data from many data sources.  

Pros:

  • Highly flexible.
  • Provides a variety of visualization options.

Cons: 

  • It lacks predictive analysis. 
  • Does not support 3D charts.  

There you have it! Now you know the tools to ask out on a date when you are ready to visualize your data. As much as you love data, these tools can help make others fall in love with your data, too.   

Copyright Enforcement Tools as Censorship

This week, Scholarly Commons graduate assistants Zhaneille Green and Ryan Yoakum, alongside Copyright Librarian Sara Benson, appeared as guest writers for the International Federation of Library Associations and Institutions’ blog as part of a series for Copyright Week. Their blog post looks at how the current copyright tools on platforms such as YouTube and Facebook allow large corporate or governmental entities to silence and suppress individual voices. You can read the full blog post on the IFLA blog website.

When did you first fall in love with data?

This post is part of a series for Love Data Week, which takes place February 14-18 2022.

Written by Lauren Phegley

Picture it – North Central College, Illinois, 2018. Twenty-one-year-old sociology major Laurent Phegley takes her seat in Professor Corsino’s class with no idea that she’s about to fall in love…with data. At the time, Dr. Corsino studied occupational attainment of Italian immigrants in Chicago Heights during the 1900’s. Lauren and her classmates sifted through census data to piece together the career tracks of (mostly male) Italian Americans. These data weren’t just checkmarks on a form. They were glimpses into entire families, glimpses that when pieced together told a story about how the American dream operates on the basis of social class. “For me, tracking the individuals through the census was a large puzzle,” Lauren says. Since then, Lauren has focused on helping other researchers solve their data puzzles. “Social science students are often not taught about data management because they don’t see their research as relating to ‘data’. I make a concerted effort now in my work and teaching to target fields that are often forgot about in terms of data management. Research is a labor of love. It is well worth a few hours of time to make sure that your data stays useable and understandable!”

Headshot of LaurenLauren Phegley is a graduate assistant for the Library Research Data Service pursuing her Masters of Science in Library and Information Science at the University of Illinois iSchool. Once she graduates in May 2022, she hopes to work as an academic librarian helping researchers manage their data and research.

It Matters How We Open Knowledge: Open Access Week 2021

It’s that time of year again! Open Access Week is October 25-31, and the University of Illinois Library is excited to participate. Open Access Week is an international event where the academic and research community come together to learn about Open Access and to share that knowledge with others. The theme guiding this year’s discussion of open access will be “It Matters How We Open Knowledge: Building Structural Equity.”

These discussions will build on last year’s theme of “Open with Purpose: Taking Action to Build Structural Equity and Inclusion.” While last year’s theme was intended to get people thinking about the ways our current information systems marginalize and exclude, this year’s theme is focused on information equity as it relates to governance.

OA Week digital banner with theme name and date

Specifically, this year’s theme intentionally aligns with the recently released United Nations Educational, Scientific and Cultural Organization (UNESCO) recommendation on Open Science, which encompasses practices such as publishing open research, campaigning for open access, and generally making it easier to publish and communicate scientific knowledge.

Circulated in draft form following discussion by representatives of UNESCO’s 193 member countries, the recommendation powerfully articulates and centers the importance of equity in pursuing a future for scholarship that is open by default. As the first global standard-setting framework on Open Science, the UNESCO Recommendation will provide an important guide for governments around the world as they move from aspiration to the implementation of open research practices.

UNESCO Icon

While the University of Illinois is not hosting any formal events for open access, the Library encourages students, staff, and faculty to familiarize themselves with existing open access resources, including:

  • IDEALS: The Illinois Digital Environment for Access to Learning and Scholarship, collects, disseminates, and provides persistent and reliable access to the research and scholarship of faculty, staff, and students at Illinois. Once an article is deposited in IDEALS, it may be efficiently and effectively accessed by researchers around the world, free of charge.
  • Copyright: Scholarly Communication and Publishing offers workshops and consultation services on issues related to copyright. While the Library cannot offer legal advice, we can help you to identify information and issues you may want to consider in addressing your copyright question.
  • Illinois Open Publishing Network: The Illinois Open Publishing Network (IOPN) is a set of digital publishing initiatives that are hosted and coordinated at the University of Illinois at Urbana-Champaign Library. IOPN offers a suite of publishing services to members of the University of Illinois at Urbana-Champaign community and aims to facilitate the dissemination of high-quality, open access scholarly publications. IOPN services include infrastructure and support for publishing open access journals, monographs, born-digital projects that integrate multimedia and interactive content.

IOPN logo

For more information on how to support access at the University of Illinois, please reach out to the Scholarly Commons or the Scholarly Communication and Publishing unit. For more information about International Open Access Week, please visit www.openaccessweek.org. Get the latest updates on Open Access events on twitter using the hashtag #OAWeek.

Welcome to the new Scholarly Commons!

The staff at the Scholarly Commons are excited to welcome you to our new location in Room 220 of the Main Library! Over the course of the past year of remote work, we have been making progress on getting 220 ready for patron use by the start of the Fall semester and officially opened our new space on August 9th.

Study tables arranged in two rows with students studying.

Study tables located in Room 220

The new Scholarly Commons in Room 220 is a much bigger space that can accommodate more patrons, support individual and group study, host research consultations, and more. We have brand new soft furniture that patrons can lounge in, as well as several study tables that come with screen-casting monitors for easy collaboration.

Individual study pod with clear glass doors

Rooms available to reserve for individual or group study

Our patrons have also been excited about the group collaboration rooms, which are brand new to the Scholarly Commons. These rooms can be reserved for individual study or group meetings. They are glass-enclosed spaces with adjustable lighting, a monitor for screen-casting, and air conditioning. The pods can be reserved for two hours at a time through the library’s online reservation portal.

The Scholarly Commons mission of supporting the advanced research needs of the University of Illinois at Urbana-Champaign community continues in our new space, where we have 14 desktop computers equipped with specialized research software. A full list of software available in Room 220 is available on the Scholarly Commons website. You can also receive statistical consulting services through the Center for Innovation in Teaching and Learning in Room 220 during their drop-in hours. Our scanning equipment is also now located in Room 220, including our new KIC Bookeye Book Scanning Station.

Bookeye scanner with touchscreen and two flatbed scanners

Bookeye and Flatbed scanners

The Scholarly Commons service desk is also now located in Room 220 and is the best way to get immediate help from one of our staff members. We will also be available via our online chat and through email (sc@library.illinois.edu) during our oprerating hours, Monday-Thursday, 10am-4pm and Fridays 10am-noon. You can also visit Room 220 outside of these hours – the room will be available for use whenever the Main Library building is open.

We are so excited to be back on campus and in our new space. We look forward to seeing you at the new Scholarly Commons!

Meet Michelle Reed: New Head of The Scholarly Commons

Head shot of Michelle Reed from the chest up

It is an exciting time for our unit because we finally have a new head of the Scholarly Commons, Michelle Reed! We want to give our readers a chance to learn more about Michelle and her career in this blog post.

Before joining us, Michelle worked as Associate Librarian and Director of Open Educational Resources at the University of Texas at Arlington Libraries. In that role Michelle led efforts to support the adoption, modification, and creation of open educational resources (OER). She oversaw the university’s financial investment in OER, managed the OER publishing activities of Mavs Open Press, and collaborated with UTA faculty to secure external grant funding for OER development, including a $582,322 grant from the U.S. Department of Education to create a series of transportation resources.

Michelle Reed giving a presentation at a podium

Prior to joining UTA, Michelle supported both information literacy and scholarly communication at the University of Kansas Libraries. She also worked as a technical writer and editor for a Department of Energy waste management center and a small research and manufacturing business specializing in neurophysiological research tools.

In her new role as the head of the Scholarly Commons she hopes to build collaborative relationships with partners from within the library and across campus to support the use and exploration of digital tools, broaden access to scholarship, and enhance the university’s research output.

To learn more about Michelle, you can visit her website librariansreed.com.

Simple NetInt: A New Data Visualization Tool from Illinois Assistant Professor, Juan Salamanca

Juan Salamanca Ph.D, Assistant Professor in the School of Art and Design at the University of Illinois Urbana-Champaign recently created a new data visualization tool called Simple NetInt. Though developed from a tool he created a few years ago, this tool brings entirely new opportunities to digital scholarship! This week we had the chance to talk to Juan about this new tool in data visualization. Here’s what he said…

Simple NetInt is a JavaScript version of NetInt, a Java-based node-link visualization prototype designed to support the visual discovery of patterns across large dataset by displaying disjoint clusters of vertices that could be filtered, zoomed in or drilled down interactively. The visualization strategy used in Simple NetInt is to place clustered nodes in independent 3D spaces and draw links between nodes across multiple spaces. The result is a simple graphic user interface that enables visual depth as an intuitive dimension for data exploration.

Simple NetInt InterfaceCheck out the Simple NetInt tool here!

In collaboration with Professor Eric Benson, Salamanca tested a prototype of Simple NetInt with a dataset about academic publications, episodes, and story locations of the Sci-Fi TV series Firefly. The tool shows a network of research relationships between these three sets of entities similar to a citation map but on a timeline following the episodes chronology.

What inspired you to create this new tool?

This tool is an extension of a prototype I built five years ago for the visualization of financial transactions between bank clients. It is a software to visualize networks based on the representation of entities and their relationships and nodes and edges. This new version is used for the visualization of a totally different dataset:  scholarly work published in papers, episodes of a TV Series, and the narrative of the series itself. So, the network representation portrays relationships between journal articles, episode scripts, and fictional characters. I am also using it to design a large mural for the Siebel Center for Design.

What are your hopes for the future use of this project?

The final goal of this project is to develop an augmented reality visualization of networks to be used in the field of digital humanities. This proof of concept shows that scholars in the humanities come across datasets with different dimensional systems that might not be compatible across them. For instance, a timeline of scholarly publications may encompass 10 or 15 years, but the content of what is been discussed in that body of work may encompass centuries of history. Therefore, these two different temporal dimensions need to be represented in such a way that helps scholars in their interpretations. I believe that an immersive visualization may drive new questions for researchers or convey new findings to the public.

What were the major challenges that came with creating this tool?

The major challenge was to find a way to represent three different systems of coordinates in the same space. The tool has a universal space that contains relative subspaces for each dataset loaded. So, the nodes instantiated from each dataset are positioned in their own coordinate system, which could be a timeline, a position relative to a map, or just clusters by proximities. But the edges that connect nodes jump from one coordinate system to the other. This creates the idea of a system of nested spaces that works well with few subspaces, but I am still figuring out what is the most intuitive way to navigate larger multidimensional spaces.

What are your own research interests and how does this project support those?

My research focuses on understanding how designed artifacts affect the viscosity of social action. What I do is to investigate how the design of artifacts facilitates or hinders the cooperation of collaboration between people. I use visual analytics methods to conduct my research so the analysis of networks is an essential tool. I have built several custom-made tools for the observation of the interaction between people and things, and this is one of them.

If you would like to learn more about Simple NetInt you can find contact information for Professor Juan Salamanca here and more information on his research!

If you’re interested in learning more about data visualizations for your own projects, check out our guide on visualizing your data, attend a Savvy Researcher Workshop, Live Chat with us on Ask a Librarian, or send us an email. We are always happy to help!

Save The Date: 10th Anniversary!

Text: Celebrate a decade with the Scholarly Commons. Background: fireworks and party banner.

This month marks the 10th anniversary of the Scholarly Commons! To celebrate this momentous occasion, the Scholarly Commons is presenting a digital exhibition commemorating our history. This digital exhibition will highlight the projects, partnerships, and people that supported the unit over the past ten years. The exhibition will include:

An Interactive Timeline of the Scholarly Commons History

The Scholarly Commons has celebrated many milestones over the course of the past decade. From creating the Savvy Researcher Workshops to hosting symposiums and competitions to inviting guest scholars to the UIUC campus to share their ideas and projects with our community. The Scholarly Commons has created long-lasting initiatives that enrich the academic life of the UIUC. 

To commemorate some of our biggest achievements, the Scholarly Commons has created a timeline featuring the projects, partnerships, and people who have built the Scholarly Commons through the years. To read these highlights and learn about the future of the Scholarly Commons, you can view the timeline here.

A GIS Mapping Project Highlighting Former Scholarly Commons Graduate Assistants

Graduate Assistants play a valuable role in keeping the Scholarly Commons functional and efficient. They provide consultation services for patrons, develop instructional materials for technologies and tools in the Scholarly Commons, facilitate in-person and virtual workshops, and perform a wide variety of other tasks. By the time they graduate and leave the Scholarly Commons, our hope is that our Graduate Assistants gain new technical skills, form long-lasting relationships, and develop a profound sense of professionalism and responsibility that they will carry with them throughout their careers.

To recognize the achievements of our former GAs, the Scholarly Commons has created an interactive map showcasing where they are now and how their time with the Scholarly Commons impacted their careers. To see the global influence of the Scholarly Commons for yourself, you can view the map here.  

A Talk by Guest Speaker Thomas Padilla

Thomas Padilla in a study space at the University of Nevada Libraries

Thomas Padilla at the University of Nevada Libraries

On Tuesday October 20, 2020 from 3:30-4:30pm, former Scholarly Commons Graduate Assistant and current Interim Head of Knowledge Production at the University of Nevada Las Vegas Libraries Thomas Padilla will lead a discussion around the importance of responsible operations in libraries. 

Drawing on his experience leading development of the research agenda Responsible Operations: Data Science, Machine Learning, and AI in Libraries, Padilla will discuss how cultural heritage practitioners and their partners can improve collection description and discovery, develop machine actionable collections, and create space for members of their organizations to expand skills and deepen cross-functional community partnerships using data science, machine learning, and AI technology. To attend this lecture, use this Zoom Webinar Link

To stay updated on all these events and more, please visit our 10th anniversary webpage on the Scholarly Commons website. Thank you all for celebrating 10 years with us!