A Non-Data Scientist’s Take on Orange

Introduction

Coming from a background in the humanities, I have recently developed an interest in data analysis but am just learning how to code. While I have been working to remedy that, one of my professors showed me this program known as Orange. Created in 1996, Orange is primarily designed to help researchers through the data analysis process, whether that is by applying machine learning methods or visualizing data. It is an open-source program (meaning you can download it for free!) and uses a graphical user interface (GUI) that allows the user to perform their analysis by matching icons to one another instead of having to write code.

How it Works

Orange works by using a series of icons known as widgets to perform the various functions that a user would otherwise need to manually code if they were using a program such as Python or R. Each widget appears as a bubble that can be moved around the interface. Widgets are divided into various categories based on the different steps in the analysis process. You can draw lines between the widgets to create a sequence, which will determine the process for how that data is analyzed (which is also known as a workflow). In its current state, Orange contains 96 widgets, each with different customizable and interactive components, so there are many opportunities for performing different types of basic data analysis with this software.

To demonstrate, I will use a dataset about the nutrition facts in specific foods (courtesy of Kaggle) to see how accurately a machine learner can predict the food group a given item falls in based on its nutrients. The following diagram is the workflow I designed to analyze this data:

This is the workflow I designed to analyze a sample sheet of data. From left to right, the widgets placed are "File," "Logistic Regression," "Test and Score," and "Confusion Matrix."

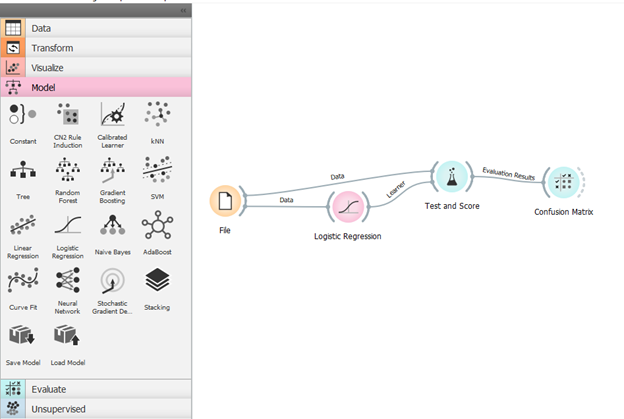
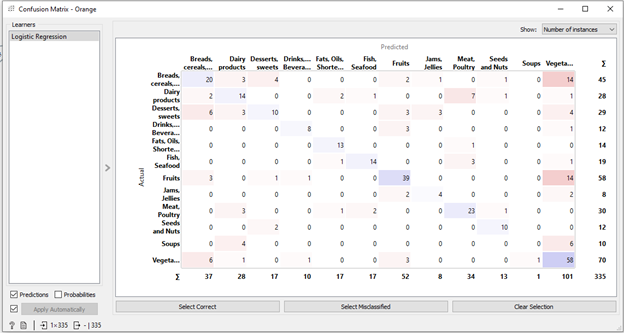
On the left side of the screen are different tabs that each contain a series of widgets related to the task at hand. By clicking on the specific widgets, a pop-up window appears that allows you to interact with the widget. In this particular workflow, the “file” widget is where I can upload the file I want to analyze (there are a lot of different formats you can upload too; in this case, I uploaded an Excel spreadsheet). From there, I chose the machine learning method that I wanted to use to classify the data. The third widget tests the data using the classification method, and compares it to the original data. Finally, the results are visualized through the “confusion matrix” widget to show which cases the machine learner accurately predicted and which ones it got wrong.

A confusion matrix of the predicted classification of food items based on the amount of nutrients in them compared to the actual classifications .

The Limitations

While Orange is a helpful tool for those without a coding background, this system also presents some limitations when it comes to performing certain types of data analysis. One way Orange tries to reconcile this is by providing a widget where the user can insert some Python script into the workflow. While this feature may be helpful for those with a coding background, it would not really impact those who do not have a coding background, thereby limiting the ways they can analyze data.

Additionally, although Orange can visualize data, there are not many features that allow users to adjust the visualization’s appearance. Such limitations may require exporting the data and using another tool to create a more accessible or visually appealing data visualization, but for now, Orange is quite limited in this capacity. As a result, Orange is an incredibly useful tool for basic data visualization but struggles with more advanced types of data science work that may require using other tools or programming to accomplish.

Final Remarks

If you are looking to get involved in data analysis but are just starting to develop an interest in coding, then Orange is a great tool to use. Unlike most data analysis programs, the user-designed interface of Orange makes it easy to perform basic types of data analysis through its widgets. It is far from perfect though, and a lack of a coding background is going to limit the ways you can analyze and visualize your data. Nevertheless, Orange can be an incredibly useful tool if you are just starting to learn how to code and looking to understand the basics of data science!

Welcome Back to the Scholarly Commons!

The Scholarly Commons is excited to announce we have merged with the Media Commons! Our units have united to provide equitable access to innovative spaces, digital tools, and assistance for media creation, data visualization, and digital storytelling. We launched a new website this summer, and we’re thrilled to announce a new showcase initiative that highlights digital projects created by faculty and students. Please consider submitting your work to be featured on our website or digital displays. 

Looking to change up your office hours? Room 220 in the Main Library is a mixed-used space with comfortable seating and access to computers and screen-sharing technology that can be a great spot for holding office hours with students. 

Media Spaces

We are excited to announce new media spaces! These spaces are designed for video and audio recordings and equipped to meet different needs depending on the type of production. For quick and simple video projects, Room 220 has a green-screen wall on the southeast side of the room (adjacent to the Reading Room). The space allows anyone to have fun with video editing. You can use your phone to shoot a video of yourself in front of the green wall and use software to replace the green with a background of your choosing to be transported anywhere. No reservations required.

Green Screen Wall in Room 220. Next to it is some insignificant text for design purposes.

For a sound-isolated media experience, we are also introducing Self-Use Media Studios in Rooms 220 and 306 of the Main Library. These booths will be reservable and are equipped with an M1 Mac Studio computer, two professional microphones, 4K video capture, dual color-corrected monitors, an additional large TV display, and studio-quality speakers. Record a podcast or voiceover, collect interviews or oral histories, capture a video or give a remote stream presentation, and more at the Self-Use Media Studios.

Finally, we are introducing the Video Production Studio in Room 308. This is a high-end media creation studio complete with two 6K cameras, an 4K overhead camera, video inputs for computer-based presentation, professional microphones, studio-lighting, multiple backdrops, and a live-switching video controller for real-time presentation capture or streaming. Additionally, an M1 Mac Studio computer provides plenty of power to enable high-resolution video project editing. The Video Production Studio can be scheduled by arranged appointment and will be operated by Scholarly Commons staff once the space is ready to open. 

Stay tuned to our spaces page for more information about reserving these resources.

Loanable Tech

The Scholarly and Media Commons are pleased to announce the re-opening of loanable technology in Room 306 of the Main Library. Members of the UIUC community can borrow items such as cameras, phone chargers, laptops, and more from our loanable technology desk. The loanable technology desk is open 10:30 a.m. – 7:30 p.m. Mondays-Thursdays, 10:30 a.m. – 5:30 p.m. Fridays, and 2-6:30 p.m. on Sundays. Check out the complete list of loanable items for more on the range of technology we provide.

Drop-in Consultation Hours

Drop-in consultations have returned to Room 220. Consultations this semester include:

  • GIS with Wenjie Wang – Tuesdays 1 – 3 p.m. in Consultation Room A.
  • Copyright with Sara Benson – Tuesdays 11 a.m. – 12 p.m. in Consultation Room A.
  • Media and design with JP Goguen – Thursdays 10 a.m. – 12 p.m. in Consultation Room A.
  • Data analysis with the Cline Center for Advanced Social Research – Thursdays 1 – 3 p.m. in Consultation Room A.
  • Statistical consulting with the Center for Innovation, Technology, and Learning (CITL) – 10 a.m. – 5 p.m. Mondays, Tuesdays, Thursdays, and Fridays, as well as 10 a.m. – 4 p.m. Wednesdays in Consultation Room B.

Finally, a Technology Services help desk has moved into Room 220. They are available 10 a.m. – 5 p.m. Mondays-Fridays to assist patrons with questions about password security, email access, and other technology needs.

Spatial Computing and Immersive Media Studio

Later this fall, we will launch the Spatial Computing and Immersive Media Studio (SCIM Studio) in Grainger Library. SCIM Studio is a black-box space focused on emerging technologies in multimedia and human-centered computing. Equipped with 8K 360 cameras, VR and AR hardware, a 22-channel speaker system, Azure Kinect Depth Cameras, Greenscreen, and a Multi-Camera and display system for Video Capture & Livestreaming, SCIM Studio will cater to researchers and students interested in utilizing the cutting edge of multimedia technology. The Core i9 workstation equipped with Nvidia A6000 48GB GPU will allow for 3D modeling, Computer Vision processing, Virtual Production compositing, Data Visualization/Sonification, and Machine Learning workflows. Please reach out to Jake Metz if you have questions or a project you would like to pursue at the SCIM Studio and keep your eye on our website for launch information. 

Have Questions?

Please continue to contact us through email (sc@library.illinois.edu) for any questions about the Scholarly and Media Commons this year. Finally, you can check out the new Scholarly Commons webpage for more information about our services, as well as our staff directory to set up consultations for specific services. 

We wish you all a wonderful semester and look forward to seeing you here at the Scholarly and Media Commons!

5 Things for Educators to Know About Copyright Before Posting on Youtube

Making Youtube videos can be a fun and easy way to incorporate new media into a virtual classroom and provide an alternative to live lectures. That being said there are a few copyright concerns to keep in mind before you post. Youtube is a public online space that anyone can access, so the guidelines for copyright compliance are different than if you were in a traditional classroom setting. Read through this post and the recommended resources before you get started. Disclaimer: I am not a lawyer and this is not legal advice, it is just some information and resources I’ve come across in my research on this topic.

  1. Youtube WILL take your video down if you use copyrighted content that does not belong to you! Youtube uses software, such as the Copyright Match Tool and Content ID, to detect when content is shared by someone who is not the creator. If your video if flagged by these tools it may be taken down instantly. The process to get a video re-posted is complicated and your account may even be suspended. So, be very careful if you want your videos to stay online!
  2. Youtube does recognize research and teaching as conditions for Fair Use, but only on a case-by-case basis after your video has been flagged. It is best not to use copyrighted content in your videos but if you absolutely MUST, there are some ways you can set yourself up well for a Fair Use case. First, be sure to tag your video with metadata that make it clear this is an educational video. Second, when you make your channel be sure to brand yourself as an educator. For example, if your channel is called something like “Professor Smith’s Political Science Classroom” that is a pretty solid indicator that your channel is educational in nature. Third, only use what is absolutely necessary to your lesson. Don’t post a whole video clip if you are only analyzing 5 seconds of it. Even if you follow all this advice your video may still be taken down so save yourself the trouble and try not to use copyrighted material. If you want to learn more about Fair Use, visit our Library Guide on the subject.
  3. You can easily find images, music, and video clips that have a creative commons license. It is no fun to make a video with no music or images. Fortunately, you can find many of these with a Creative Commons license. A Creative Commons license is when a creator has given permission for their content to be used freely by anyone. One of the best places to find creative commons content are CreativeCommons.org but Youtube even has some creative commons content of their own in the Youtube Audio Library. Be sure to consult these resources before using copyrighted content.
  4. You can give your content a Creative Commons License using the setting on Youtube. If you are open to others using a remixing your content without getting flagged for copyright infringement, you can change your terms of service to allow for this. All Youtube videos are automatically given the standard Youtube License but if you go to the Terms of Service in your account setting this can be changed to a Creative Commons License. That being said, only videos that contain 100% original content can be given this license on the platform. Read the Youtube Terms of Service to learn more.
  5. Are you still not sure if you are violating copyright with your videos? Youtube has a Copyright Troubleshooting feature! Youtube provides a lot of great resources for creators and this one is pretty cool. If you need  more clarification on what is and is not a violation of copyright you can use this Copyright Troubleshooter tool that will take you through a series of multiple choice questions that get to the heart of your issues and provide an answer.

In summary, Youtube is a great place to put your content if you want it to be easily accessible but it is important to respect copyright in the process. For more information you can consult these resources:

Meet Wenjie Wang, the Scholarly Common’s Geographical Information System Specialist

Headshot of Wenjie Wang, wearing a black suit with a blue shirt and blue striped tie. Standing in front of trees.

This latest installment of our series of interviews with Scholarly Commons experts and affiliates features Wenjie Wang, Geographic Information Science Specialist at the Scholarly Commons. Welcome, Wenjie!


What is your background and work experience?

I worked as a Data Specialist at the Map and Geographic Information Center (MAGIC) in the University of Connecticut for five years. MAGIC is located within the Library’s digital scholarship lab, Greenhouse Studios, I worked alongside digital humanities and digital scholarship colleagues with a focus on utilizing geospatial data, GIS applications, and spatial data analysis techniques to contribute to projects within Greenhouse Studios as well as to support researchers at MAGIC. I have had the opportunity of working within diverse environments and my experiences have been enriched by working with students, faculty, staff, and the community from diverse backgrounds and experiences.


What led you to be a GIS specialist?

In my former role as a teaching assistant for Geography courses, I realize that introducing GIS tools and methods to students in the geography class is always a challenge, as students have very different educational and technological backgrounds. Many students lack the core comprehension of geospatial concepts, have not used or even heard of GIS software before. With MAGIC receiving over 5 million online users a year, I truly understand how important GIS could be in students’ research. I think my interdisciplinary interests can put me in a strong position to bridge conversations between individuals from diverse backgrounds and I can help them use GIS as a tool in their research.


What are your favorite projects you’ve worked on?

I created maps to provide a quick and user-friendly way for communities to reflect on the differences in child outcomes across the local communities in Connecticut. My knowledge of GIS was utilized to analyze data and create maps to help match proven school readiness solutions with unique needs faced by communities for the organization. This is my first big project and it is very meaningful. I learned a lot from this project, so it is my favorite project so far.


What are some of your favorite resources that you would recommend to researchers?

I would like to recommend two data resources: IPUMS and TIGER/Line Shapefiles. IPUMS provides census and survey data, including tabular U.S. Census data, historical and contemporary U.S. health survey data, Integrated data on population and the environment, and much more. TIGER/Line shapefiles contain features such as roads, hydrographic features and boundaries. These resources are very useful for researchers who just start to use GIS since they are free and easy to handle.


If you could recommend one book or resource to researchers who do not have GIS background, what would you recommend?

Because many researchers just want to use GIS as a tool in their research field and they don’t have plenty of time to learn GIS, I would like to recommend Esri Training Web Courses. The courses are free and short. Through these entry level courses, researchers can easily learn what is GIS, how a GIS works, how to analyze and manage GIS data, and so on. After that, they will be able to know what kind of GIS technologies and data is useful in their research. And then they can focus on learning these parts.


What is the one thing you would want people to know about your field?

I would like to say GIS is not just making maps. GIS can help us make detailed and informative maps, but GIS can do much more than this. The most important part of GIS is its ability to help us think spatially and answer our questions. I hope I will be able to help researchers to understand GIS can be used as a tool in both problem solving and decision-making processes in their research.


Interested in contacting Wenjie? You can email him at wenjiew@illinois.edu , or set up a consultation request through the Scholarly Commons website.

Undergraduate Research at the Scholarly Commons

While the research conducted by graduate students and faculty has been a trademark of the University of Illinois for over a century, undergraduate research is often overshadowed. Why is undergraduate research important? As the Office of Undergraduate Research explains, “Our [mission] is guided by the philosophy that all Illinois undergraduate students should learn about current disciplinary research, take part in research discussions, and be exposed to research experiences in their regular coursework.” Learning how to do research in a field is quickly becoming part of what it means to learn a field.

As a source for digital content creation and scholarly communication, the Scholarly Commons has built on this mission to provide a digital publishing base for these bright students through the Undergraduate Research Journals. These journals have the dual purpose of showcasing the work our undergraduates are doing while giving experience to students, both undergraduate and graduate, in running their own academic journals.

Through the open-access framework of Open Journal System, these journals present work from disciplines across campus ranging from English to Agricultural sciences. Some of these journals have had print runs in the past, or continue to print conventionally, while others are taking advantage of the online format to start new publishing opportunities.

The Illini Journal of International Security is one such journal. Through the Program in Arms Control & Domestic and International Security, IJOIS is a new journal publishing this year accepting cross-disciplinary approaches to international security issues.

Our Undergraduate Research Journals are a window into the exciting work being done by undergraduates across campus, and we encourage our readers to check each of the journals out at https://ugresearchjournals.illinois.edu/.

-Posted on behalf of Dylan Burns