Data Storytelling with Scholarly Commons

What is Data Storytelling? 

Oftentimes data is presented in a manner that is dry or incomprehensible to a general audience. Data storytelling is a more interactive and compelling way to present information. Data storytelling is defined as using visualizations to tell a narrative that communicates insights about data to a wider audience.  
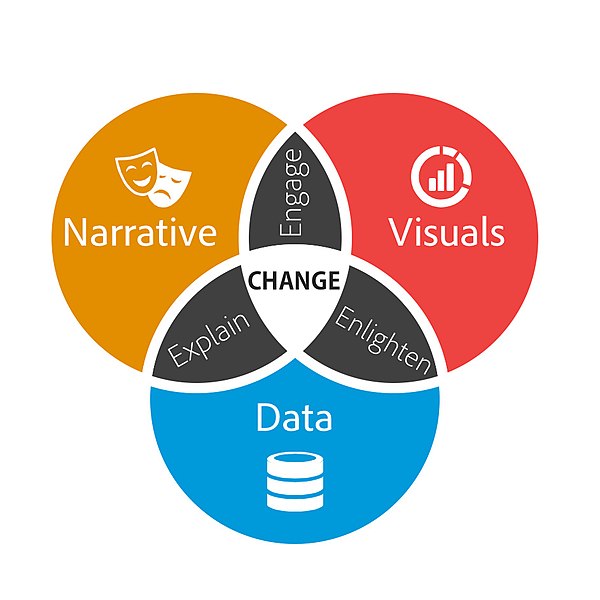
Venn diagram with three circles which are narrative, visuals and data. Where visuals and narrative overlap says engage. Where visuals and data overlap says enlighten. Where narrative and data overlap says explain. In the intersection of all three circles says change.  
Brent Dykes, CC BY-SA 2.5, via Wikimedia Commons 
 

When writing a data story, start by collecting your data. Look for the most interesting trends and determine the main points you want to get across in your data story. A data story should have a complete narrative rather than being a series of barely connected data visualizations. Make sure the story you are telling is appropriate for your audience.  

Resources for Creating a Data Story: 

The Scholarly Commons Collection is located in the UIUC Main Stacks. Books in this collection are available to check out. The collection includes books that provide introductory information to data storytelling. 

  1. Effective data storytelling : how to drive change with data, narrative and visuals 

This resource is available to UIUC faculty, staff, and students online. It focuses especially on the narrative aspects of data storytelling rather than the visualization aspect. This book explains the psychology of why storytelling is such an effective communication tool.  

  1. Storytelling with data : a data visualization guide for business professionals 

This resource is only available as a physical book. Data storytelling is a method often used by business professionals to impart information in a more meaningful and persuasive way. This book speaks specifically to business professionals and explains how to consider context, determine the appropriate format for the story, and speak to an audience in a compelling way.  

  1. Storytelling with data : let’s practice! 

This book is also available online with an active illinois.edu email address. It provides over 100 hands-on exercises to help you to gain practice in choosing effective visuals, keeping your visualizations clean, and telling a story.  

Scholarly Commons also provides access to various software that can be accessed on the computers in Main Library room 220. These tools can also be accessed through UIUC Anyware. Useful software for data storytelling includes: 

  1. Tableau Public

Tableau is a popular data visualization tool with many features useful for making many types of visualizations, such as histograms, pie charts, and boxplots. Tableau also allows users to create dashboards which create a comprehensive story by combining visuals and data.  

 Dashboard created in Tableau
Marissa-anna, CC BY-SA 4.0, via Wikimedia Commons 

  1. ArcGIS 

ArcGIS software allows you to create maps and add data to them. This tool would be especially useful if your data is geographically focused. ArcGIS StoryMaps is an additional tool that allows you to create a story using images, texts, maps, lists, videos and other forms of media.  

Map of Covid cases created in ArcGIS

Dennis Sylvester Hurd, CC-BY 2.0, via Flickr 

If you have data you need to share with an audience, consider sharing it through a data story. Data stories are often more visually appealing and engaging than other methods of sharing data. The Scholarly Commons has lots of useful tools to help you create a data story! 

You can’t analyze data if you ain’t cute: Data Visualization

Meme from Reno 911 with the original text stating "You can't fight crime if you ain't cute" but the "fight crime" is crossed out and above is written "analyze Data"

Humans are highly visual creatures, even more so in our hyper-graphic world of ultra-filtered images and short aesthetic videos. Great ideas are ignored into oblivion in favor of shiny graphics and slick illustrations, so even data analysts need to be aware of how they present their findings. A well-designed infographic will be much more impactful, widely shared, and remembered than columns and rows of numbers. Even a simple graph can help people better come to conclusions and absorb information than they ever would with just numbers alone. People who can not only crunch numbers but also create stunning communications about those numbers are a real asset on the job market, so it behooves any hopeful data analyst to at least learn the basics of visualization.

LinkedIn Learning 

  1. Learning Data Visualization 
    1. This course clocks in at just under two hours and aims to give learners the scaffolding for a strong understanding of data visualization. Geared towards true beginners, this course challenges learners to think about their data, audience, and goals to create visuals that maximize impact. Learners will also learn about visual perception and chart selection strategies, which in turn can set users up for a deep understanding of visualization. 
  1. Data Visualization: Best Practices 
    1. A poorly designed visualization can be criminally misleading, causing viewers to come to biased and inaccurate conclusions that can negatively affect everything from their investment choices to their health practices. This 98-minute course will give learners the tools to avoid common visualization missteps and the tricks to make their visualizations better fit their data, audience, and goals. This course uses Adobe Illustrator, so those who are unfamiliar with the program should first check out this quick start introduction to the program on LinkedIn Learning. Remember, UIUC students have free access many Adobe products, including Adobe Illustrator!  
  2. Excel Data Visualization: Mastering 20+ Charts and Graphs 
    1. Once again, we will focus on this data skillset within the context of a familiar software, Excel. While it is not the first software that comes to mind when thinking about visualization, Excel has surprisingly powerful visualization functions that will certainly come in handy when analyzing data. This course covers the humble pie chart to the complex geospatial heat maps and 3D power maps. In just two hours, learners will be able to quickly take their data from tables to graphics.  

O’Reilly Books and Videos

Make sure you are logged into O’Reilly before clicking these links. The best way to login is to go to the library catalog’s record for a book offered through O’Reilly (Like this book on Python) and then follow the instructions on this Libguide to log in.

  1. Fundamentals of Data Visualization 
    1. This handy book goes deep into the technical aspects of data visualizations. Learners will learn basic concepts like color theory along side more complex practices like redundant coding. This eBook also provides a helpful directory of visualizations so users can quickly find visualizations that fit their needs.
  2. The Data Visualization Lifecycle 
    1. This 4-hour course covers the basics of data visualization but looks at the actual process of professional data visualization that the other resources on this list do not address. Learners will gain technical skills in building visualization and a broader understanding of data visualization as a collaborative process based on external and internal stakeholders and audiences. This course teaches users how to interact with different data cultures, collaborate with colleagues, and how to treat visualization as a product.
  3. Interactive Data Visualization for the Web 
    1. Interactive data visualization is a trending skill in almost all fields that rely on data analysis and visualization of any kind. Allowing others to interact with your data and its visualization can make the data more accessible and memorable than ever before. This book gives users the skills to make interactive visuals with the fundamental concepts and methods of D3, the most powerful JavaScript library for expressing data visually in a web browser. Even those who are new to web programming will learn the basics of HTML, CSS, JavaScript, and SVG alongside the data visualization skills.

In the Catalog 

  1. #MakeoverMonday : improving how we visualize and analyze data, one chart at a time by Andrew Michael Kriebel and Eva Katharina Murray 
    1. Hashtags can be the start of beautiful movements, as those in the data analysis field learned as their #MakeoverMonday tag sparked a complete reimagining of how professionals approach data visualization. Readers will learn concepts of data visualization while viewing the real-life results of these concepts as shown by the hashtag-inspired graphics. #MakeoverMonday shows readers the “many ways to walk the line between simple reporting and design artistry to create exactly the visualization the situation requires”.  
  2. The functional art : an introduction to information graphics and visualization by Alberto Cairo 
    1. If there are data visualization celebrities, then Alberto Cairo is an A-lister. Known for his visualization journalism, he is a self-described information designer who has become famous for his gripping visualizations that stand as both formal art and excellent communication of data. This book allows users to learn the ins and outs of design all while strolling through a gallery of amazing visualization examples. This resource leans heavily on the theory of art and design, which makes it stand out from the other resources on this list. Alberto Cairo’s other works, The Truthful Art: data, charts, and maps for communication and How Charts Lie : getting smarter about visual information  are also worthwhile and insightful reads!  
  3. Data visualisation : a handbook for data driven design by Andy Kirk 
    1. Pivoting back to the more practical side of things, this handbook offers clear and useful processes for data driven designing. Readers will learn more about the visualization workflow, formulating briefs, working with data in the context of visualization, representing data accurately, integrating interactivity, and visualization literacy. 

And that’s it, folks!

With these visualization resources, the Winter Break Data Analysis series is ending on a pretty note. Hopefully, you have been able to keep your mind sharp and develop a new skill over the last month, but even if the timing was off, these resources and many more are available to students all year long! Did you enjoy one of these resources or posts? Do you have questions about any of these topics or suggestions for future series? Please tell us about it at sc@library.illinois.edu or on twitter at @ScholCommons. Thank you for joining this series and happy analyzing!  

*hacker voice* “I’m in” – Coding and Software for Data Analysis

While data analysis has existed in one form or another for centuries, its modern concept is highly tied to a digital environment, which means that people who are looking to move into the data science field will undoubtedly need some technology skills. In the data field, the primary coding languages include Python, R, and SQL. Software is a bit more complicated, with numerous different programs and services used depending on the situation, including Power BI, Spark, SAS, Excel, to name a few. While this is overwhelming, remember that it is not important to become an expert in all of the languages and software. Becoming skilled in one language and a few of the software options, depending on your interest or on the in-demand skills on job listings, will give you the transferable skills to quickly pick up the other languages and software as needed. If this still seems to be  an overwhelming prospect, remember that the best way to eat an elephant is one bite at a time. Take your time, break up the task, and focus on one step at a time! 

LinkedIn Learning

  1. Python for Data Science Essential Training Part 1 
    1.  This 6 hour course guides users through an entire data science project that includes web scrapers, data cleaning and reformatting, generate visualizations, preform simple data analysis and create interactive graphs. The project will have users coding in Python with confidence and give learners a foundation in the Plotly library. Once completed, learners will be able to design and run their own data science projects.  
  1. R for Excel Users 
    1. With Excel being a familiar platform for many interested in data, it is an ideal bridge to more technical skills, like coding in the R language. This course is specifically designed for data analytics with its focus on statistical tasks and operations. It will take user’s Excel skills to another level while also laying a solid foundation for their new R skills. Users will be able to switch between Excel and the R Desctools package to complete tasks seamlessly, using the best of each software to calculate descriptive statistics, run bivariate analyses, and more. This course is for people who are truly proficient in Excel but new to R, so if you need to brush up your Excel skills, go back to the first post in this series and go over the Excel resources!   
  1. SQL Essential Training 
    1. SQL is the language of relational databases, so it is of interest to anyone looking to expand their data handling skills. This training is designed to give data wranglers the tools they need to use SQL effectively using the SQLiteStudio Software. Learners will soon be able to create tables, define relationships, manipulate strings, use triggers to automate actions, and use sub selects and views. Real world examples are used throughout the course and learners will finish the course by building their own SQL application. If you want a gentler introduction to SQL, check out our earlier post on SQL Murder Mystery  

O’Reilly Books and Videos (Make sure to follow these instructions for logging in!) 

  1. Data Analysts Toolbox – Excel, Python, Power BI, Alteryx, Qlik Sense, R, Tableau 
    1. This 46 hour course is not for the faint of heart, but by the end, users will be a Swiss army knife data analyst. This isn’t for true beginners, but rather people who are already familiar with the basic data analysis concepts and have a good grasp of Excel. It is included in this list because it is a great source for learning the basics of the myriad of software and programming languages that data analysts are expected to know, all in one place. The course starts with teaching users about advanced pivot tables, so if users have already mastered the basic pivot table, they should be ready for this course.  
  1. Programming for Data Science: Beginner to Intermediate 
    1. This is an expert curated playlist of courses and book chapters that is designed to help people who are familiar with the math side of data analysis, but not the computer science side. This playlist gives users an introduction to NumPy, Pandas, Python, Spark and other technical data skills. Some previous experience with coding may be helpful in this course, but patience will make up for lack of experience.  

In the Catalog

  1. Python crash course : a hands-on, project-based introduction to programming 
    1. Python is often lauded as one of the most approachable coding languages to learn and its functionality makes it popular in the data science field. So it is no surprise that there are a lot of resources on and off campus for learning Python. This approachable guide is just one of the many resources available to UIUC students, but it stands out with its contents and overall outcomes. “Python Crash Course” covers general programming concepts, Python fundamentals, and problem solving. Unlike some other resources, this guide focuses on many of Python’s uses, not just its data analytics capabilities, which can be appealing to people who want to be more versatile with their skills. However, it is the three projects that make this resource stand out from the rest. Readers will be guided in how to create a simple video game, use data visualization techniques to make graphs and charts, and build an interactive web application.  
  1. The Book of R : a first course in programming and statistics 
    1. R is the most popular coding language for statistical analysis, so it’s clearly important for data analysts to learn. The Book of R is a comprehensive and beginner friendly guide designed for readers who have no previous programming experience or a shaky mathematical foundation as readers will learn both concurrently through the book’s lessons. Starting with writing simple programs and data handling skills, learners will then move forward to producing statistical summaries of data, preforming statistical tests and modeling, create visualizations with contributed packages like ggplot2 and ggvis, write data frames, create functions, and use variables, statements, and loops; statistical concepts like exploratory data analysis, probabilities, hypothesis tests, and regression modeling, and how to execute them in R; how to access R’s thousands of functions, libraries, and data sets; how to draw valid and useful conclusions from your data; and how to create publication-quality graphics of your results.  

Join us next week for our final installment of the Winter Break Data Analysis series: “You can’t analyze data if you ain’t cute: Data Visualization for Data Analysis”    

Learn Data Analysis: What’s Math Got to do With It?

What’s math got to do with data analysis? Unfortunately, for those of us who are chronic humanities people, math has a lot to do with it. This might seem like a daunting barrier, especially if the last time you looked at a math problem was in a high school algebra class. This is also true for learners who are already skilled with the technological aspect of data analysis but are not familiar with the mathematics side of thing. However, there are so many resources available to help self-directed students learn the basics and get up to speed for the purposes of data analytics! Using the resource platforms described in last week’s blog post, these resources will have even chronic humanities people playing with numbers in no time!  

LinkedIn Learning 

  • Learning Everyday Math 
    • Look, some of us did not absorb or retain the basic math lessons of our early education. That’s okay! This is a no-judgment zone, and this 2 hour course will help users learn how to calculate percentages for tips and taxes, compare prices while shopping, find the area and volume for home-improvement projects, and learn the basics of probability.  
  • Become a Data Scientist 
    • This 21 hour Learning Path is made up of 12 courses that focus more on the statistical side of data analysis than the technical steps of the process. This course is more geared toward users with experience in IT and computers, so it is not the best for people who do not have a strong technical background. However, for those who are familiar with computer science and want to pivot into data analytics, this is an ideal curriculum.   

O’Reilly Books and Videos (Make sure to follow these instructions for logging in!)

  • Essential Math for Data Science 
    • This eBook mixes basic coding skills with math lessons to cover the essential analytical skills needed for data science work. Relevant aspects of calculus, probability, linear algebra, and statistics and how they apply to techniques like linear regression, logistic regression, and neural networks are covered in plain English. The chapters include exercises with answers for self-assessment as well as career advice for budding data analysts.   
  • Statistics for Data Science using Python 
    • Besides books, O’Reilly also has expert curated playlists that consist of chapters of several different books, videos and more. This is a great way of getting the most out of several resources to focus on a single skill. This playlist covers the essential statistic concepts found in 11 different resources. Learn about Normal distribution, hypothesis tests, p-values, central limit theorem and more without having to dig for the resources yourself!  
  •   Data Science 101: Methodology, Python, and Essential Math 
    • On top of books and playlists, O’Reilly also has video-based courses. This course covers a lot of data analytics basics, but those who want to focus on the math aspect will benefit from Chapters 15-19. These chapters cover linear algebra, mathematical structures, probability, random variables and multiple variables, and statistical inference.  

In the Catalog 

Be sure to come back next week for the thrilling continuation with “*hacker voice* I’m In: Coding and Software for Data Analysis! 

Learn Data Analysis Over the Winter Break!

In the last twenty years, humanity has become super proficient in collecting data. Therefore, It is no surprise that the skills to analyze that massive collection of data is in ever increasing demand on the job market. For those of us who are worried about future job prospects, learning these in-demand data analysis skills seems like a logical next step, even if they do not fit into our current degree program. Fortunately, the university has a plethora of self-guided resources available for students looking to build their data skills. What better time to use these resources than during the long winter break?! Over the next few weeks, this blog will delve into the available resources that cover the three main skill areas of data analysis: math, coding and software, and visualization. 

Before diving into those areas, it is wise briefly look at the foundations of data analysis as well as the resources that will be showcased this month. Take this week to get acquainted with these different resource platforms and learn a few starting skills! 

LinkedIn Learning

All UIUC students have access to LinkedIn Learning. Simply login with your NetID credentials, just be sure you are logging into LinkedIn Learning, not the main LinkedIn site.  You will have access to a whole trove of high-quality videos and courses designed to help you learn career-building skills. Not only are the videos professional grade, but they often have accompanying exercise files, learning groups, certificates and exams. The collection ranging from short 5-15 minute videos that teach specific function or skills to dozen hours long courses that are designed to give a comprehensive foundation. The best part of using LinkedIn Learning is that the course and certificates completed here are then displayed on personal LinkedIn pages, showing potential employers that users have the skills they are looking for. 

  • Data Analytics for Students
    • This course is for the true data analytics babies out there. This introduction gives users the basic understanding of what data analytics is, the skills users will need to be successful,  the software and tools common in the field and what careers in data analytics look like. This 1 hour course is well worth the time for those who aren’t sure where to start their data journey.
  • Career Essentials in Data Analysis by Microsoft and LinkedIn
    • Discover the skills needed for a career in data analysis. Learn foundational concepts used in data analysis and practice using software tools for data analytics and data visualization. This is a Learning Path made up of 3 different courses that has about 9 hours of content for students to work through on their own schedule. The courses have exams for self-evaluation as well as a final exam that earns users a professional certificate. 
  • Excel: Managing and Analyzing Data
    • We have all put “proficient in Excel” on a resume, but wouldn’t it be nice if that was actually true? Unlike other data analytics courses, this course focuses on one program that most modern users are already familiar with but do not truly harness the power of. This is ideal for baby data analysts as it doesn’t bombard learners with a whole new software ecosystem but still teaches the transferable skills all data analysts use. Running at just under 4 hours, this course efficiently and comprehensively teaches users impressive data analytics skills. 

O’Reilly Books and Videos

This is a lesser known resource available at UIUC but it has some great online books and videos that tend to focus on the scientific and technical fields. Logging in is not straightforward, unfortunately. The best way to get there is to go to the Library Catalog’s record for a book offered through O’Reilly (Like this book on Python) and then follow the instructions on this LibGuide to log in. Once you are in, you will see a sizable collection of e-books and courses. The materials skew towards the more experienced users, but there are a few resources that will help baby data folks really develop their skills. 

Library Catalog

Learn data science the old fashion way, with books! There are a lot of books available at UIUC libraries for students who want to teach themselves a new skill. Here are a few choices for people looking for an easy introduction to data analysis. The Scholarly Commons collection is easily accessible and found just to the right of the main entrance to the stacks. 

Be sure to check back here next week for our next installment, “What’s Math got to do with it?”!

Welcome Back to the Scholarly Commons!

The Scholarly Commons is excited to announce we have merged with the Media Commons! Our units have united to provide equitable access to innovative spaces, digital tools, and assistance for media creation, data visualization, and digital storytelling. We launched a new website this summer, and we’re thrilled to announce a new showcase initiative that highlights digital projects created by faculty and students. Please consider submitting your work to be featured on our website or digital displays. 

Looking to change up your office hours? Room 220 in the Main Library is a mixed-used space with comfortable seating and access to computers and screen-sharing technology that can be a great spot for holding office hours with students. 

Media Spaces

We are excited to announce new media spaces! These spaces are designed for video and audio recordings and equipped to meet different needs depending on the type of production. For quick and simple video projects, Room 220 has a green-screen wall on the southeast side of the room (adjacent to the Reading Room). The space allows anyone to have fun with video editing. You can use your phone to shoot a video of yourself in front of the green wall and use software to replace the green with a background of your choosing to be transported anywhere. No reservations required.

Green Screen Wall in Room 220. Next to it is some insignificant text for design purposes.

For a sound-isolated media experience, we are also introducing Self-Use Media Studios in Rooms 220 and 306 of the Main Library. These booths will be reservable and are equipped with an M1 Mac Studio computer, two professional microphones, 4K video capture, dual color-corrected monitors, an additional large TV display, and studio-quality speakers. Record a podcast or voiceover, collect interviews or oral histories, capture a video or give a remote stream presentation, and more at the Self-Use Media Studios.

Finally, we are introducing the Video Production Studio in Room 308. This is a high-end media creation studio complete with two 6K cameras, an 4K overhead camera, video inputs for computer-based presentation, professional microphones, studio-lighting, multiple backdrops, and a live-switching video controller for real-time presentation capture or streaming. Additionally, an M1 Mac Studio computer provides plenty of power to enable high-resolution video project editing. The Video Production Studio can be scheduled by arranged appointment and will be operated by Scholarly Commons staff once the space is ready to open. 

Stay tuned to our spaces page for more information about reserving these resources.

Loanable Tech

The Scholarly and Media Commons are pleased to announce the re-opening of loanable technology in Room 306 of the Main Library. Members of the UIUC community can borrow items such as cameras, phone chargers, laptops, and more from our loanable technology desk. The loanable technology desk is open 10:30 a.m. – 7:30 p.m. Mondays-Thursdays, 10:30 a.m. – 5:30 p.m. Fridays, and 2-6:30 p.m. on Sundays. Check out the complete list of loanable items for more on the range of technology we provide.

Drop-in Consultation Hours

Drop-in consultations have returned to Room 220. Consultations this semester include:

  • GIS with Wenjie Wang – Tuesdays 1 – 3 p.m. in Consultation Room A.
  • Copyright with Sara Benson – Tuesdays 11 a.m. – 12 p.m. in Consultation Room A.
  • Media and design with JP Goguen – Thursdays 10 a.m. – 12 p.m. in Consultation Room A.
  • Data analysis with the Cline Center for Advanced Social Research – Thursdays 1 – 3 p.m. in Consultation Room A.
  • Statistical consulting with the Center for Innovation, Technology, and Learning (CITL) – 10 a.m. – 5 p.m. Mondays, Tuesdays, Thursdays, and Fridays, as well as 10 a.m. – 4 p.m. Wednesdays in Consultation Room B.

Finally, a Technology Services help desk has moved into Room 220. They are available 10 a.m. – 5 p.m. Mondays-Fridays to assist patrons with questions about password security, email access, and other technology needs.

Spatial Computing and Immersive Media Studio

Later this fall, we will launch the Spatial Computing and Immersive Media Studio (SCIM Studio) in Grainger Library. SCIM Studio is a black-box space focused on emerging technologies in multimedia and human-centered computing. Equipped with 8K 360 cameras, VR and AR hardware, a 22-channel speaker system, Azure Kinect Depth Cameras, Greenscreen, and a Multi-Camera and display system for Video Capture & Livestreaming, SCIM Studio will cater to researchers and students interested in utilizing the cutting edge of multimedia technology. The Core i9 workstation equipped with Nvidia A6000 48GB GPU will allow for 3D modeling, Computer Vision processing, Virtual Production compositing, Data Visualization/Sonification, and Machine Learning workflows. Please reach out to Jake Metz if you have questions or a project you would like to pursue at the SCIM Studio and keep your eye on our website for launch information. 

Have Questions?

Please continue to contact us through email (sc@library.illinois.edu) for any questions about the Scholarly and Media Commons this year. Finally, you can check out the new Scholarly Commons webpage for more information about our services, as well as our staff directory to set up consultations for specific services. 

We wish you all a wonderful semester and look forward to seeing you here at the Scholarly and Media Commons!

There’s been a Murder in SQL City!

by Libby Cave
Detective faces board with files, a map and pictures connected with red string.

If you are interested in data or relational databases, then you have heard of SQL. SQL, or Structured Query Language, is designed to handle structured data in order to assist in data query, data manipulation, data definition and data access control. It is a very user-friendly language to learn with a simple code structure and minimal use of special characters. Because of this, SQL is the industry standard for database management, and this is reflected in the job market as there is a strong demand for employees with SQL skills.  

Enter SQL Murder Mystery

In an effort to promote the learning of this valuable language, Knight Labs, a specialized subsidiary of Northwestern University, created SQL Murder Mystery. Combining the known benefits of gamification and the popularity of whodunit detective work, SQL Murder Mystery aims to help SQL beginners become familiar with the language and have some fun with a normally dry subject. Players take on the role of a gumshoe detective tasked with solving a murder. The problem is you have misplaced the crime scene report and you now must dive into the police department’s database to find the clues. For true beginners with no experience, the website provides a walkthrough to help get players started. More experienced learners can jump right in and practice their skills. 

I’m on the case!

I have no experience with SQL but I am interested in database design and information retrieval, so I knew it was high time that I learn the basics. As a fan of both games and detective stories, SQL Murder Mystery seemed like a great place to start. Since I am a true beginner, I started with the walkthrough. As promised on the website, this walkthrough did not give me a complete, exhaustive introduction to SQL as a language, but instead gave me the tools needed to get started on the case. SQL as a language, relational databases and Entity Relationship Diagrams (ERD) were briefly explained in an approachable manner. In the walk through, I was introduced to vital SQL functions like “Select:, “Where”, wildcards, and “Between”. My one issue with the game was in the joining tables section. I learned later that the reason I was having issues was due to the tables each having columns with the same title, which is apparently a foundational SQL feature. The guide did not explain that this could be an issue and I had to do some digging on my own to find out how to fix it. It seems like the walkthrough should have anticipated this issue and mentioned it. That aside, By the end of the walkthrough, I could join tables, search for partial information matches, and search within ranges. With some common sense, the database’s ERD, and the new SQL coding skills, I was able to solve the crime! If users weren’t challenged enough with that task, there is an additional challenge that suggests users find the accomplice while only using 2 queries.

User interface of SQL Murder Mystery
Example of SQL Murder Mystery user interface

The Verdict is In

I really loved this game! It served as a great introduction to a language I had never used before but still managed to be really engaging. It reminded me of those escape room mystery boxes like Hunt a Killer that has users solve puzzles to get to a larger final solution. Anyone who loves logic puzzles or mysteries will enjoy this game, even if they have no experience with or even interest in coding or databases.  If you have some free time and a desire to explore a new skill, you should absolutely give SQL Murder Mystery a try!

Introducing Drop-In Consultation Hours at the Scholarly Commons!

Do you have a burning question about data management, copyright, or even how to work Adobe Photoshop but do not have the time to set up an appointment? This semester, the Scholarly Commons is happy to introduce our new drop-in consultation hours! Each weekday, we will have an expert from a different scholarly subject have an open hour or two where you can bring any question you have about that’s expert’s specialty. These will all take place in room 220 in the Main Library in Group Room A (right next to the Scholarly Commons help desk). Here is more about each session:


Mondays 11 AM – 1 PM: Data Management with Sandi Caldrone

This is a photo of Sandi Caldrone, who works for Research Data Services and will be hosting the Monday consultation hours from 11 AM - 1 PMStarting us off, we have Sandi Caldrone from Research Data Services offering consultation hours on data management. Sandi can help with topics such as creating a data management plan, organizing/storing your data, data curation, and more. She can also help with questions around the Illinois Data Bank and the Dryad Repository.


Tuesdays 11 AM – 1 PM: GIS with Wenjie Wang

Next up, we have Wenjie Wang from the Scholarly Commons to offer consultation about Geographic Information Systems (GIS). Have a question about geocoding, geospatial analysis, or even where to locate GIS data? Wenjie can help! He can also answer any questions related to using ArcGIS or QGIS.


Wednesdays 11 AM – 12 PM: Copyright with Sara Benson

This is a photo of Copyright Librarian Sara Benson who will be hosting the Wednesday consultation hours from 11 AM - 12 PMDo you have questions relating to copyright and your dissertation, negotiating an author’s agreement, or seeking permission to include an image in your own work? Feel free to drop in during Copyright Librarian Sara Benson’s open copyright hours to discuss any copyright questions you may have.


Thursdays 1-3 PM: Qualitative Data Analysis with Jess Hagman

This is a photo of Jess Hagman, who works for the Social Science, Education, and Health Library and will be hosting the Thursday consultation hours from 1 PM - 3 PMJess Hagman from the Social Science, Health, and Education Library is here to help with questions related to performing qualitative data analysis (QDA). She can walk you through any stage of the qualitative data analysis process regardless of data or methodology. She can also assist in operating QDA software including NVivo, Atlas.ti, MAXQDA, Taguette, and many more! For more information, you can also visit the qualitative data analysis LibGuide.


Fridays 10 AM – 12 PM: Graphic Design and Multimedia with JP Goguen

To end the week, we have JP Goguen from the Scholarly/Media Commons with consultation hours related to graphic design and multimedia. Come to JP with any questions you may have about design or photo/video editing. You can also bring JP any questions related to software found on the Adobe Creative Cloud (such as Photoshop, InDesign, Premiere Pro, etc.).


Have another Scholarly Inquiry?

If there is another service you need help with, you are always welcome to stop by the Scholarly Commons help desk in room 220 of the Main Library between 10 AM – 6 PM Monday-Friday. From here, we can get you in contact with another specialist to guide you through your research inquiry. Whatever your question may be, we are happy to help you!

Introductions: What is Data Analysis, anyway?

This post is part of a series where we introduce you to the various topics that we cover in the Scholarly Commons. Maybe you’re new to the field or you’re just to the point where you’re just too afraid to ask… Fear not! We are here to take it back to the basics!

So, what is Data Analysis, anyway?

Data analysis is the process of examining, cleaning, transforming, and modeling data in order to make discoveries and, in many cases, support decision making. One key part of the data analysis process is separating the signal (meaningful information you are trying to discover) from the noise (random, meaningless variation) in the data.

The form and methods of data analysis can vary widely, and some form of data analysis is present in nearly every academic field. Here are some examples of data analysis projects:

  • Taylor Arnold, Lauren Tilton, and Annie Berke in “Visual Style in Two Network Era Sitcoms” (2019) used large-scale facial recognition and image analysis to examine the centrality of characters in the 1960s sitcoms Bewitched and I Dream of Jeannie. They found that Samantha is the distinctive lead character of Bewitched, while Jeannie is positioned under the domination of Tony in I Dream of Jeannie.
  • Allen Kim, Charuta Pethe, Steven Skiena in “What time is it? Temporal Analysis of Novels(2020) used the full text of 52,183 fiction books from Project Gutenberg and the HaithiTrust to examine the time of day that events in the book took place during. They found that events from 11pm to 1am became more common after 1880, which the authors attribute to the invention of electric lighting.
  • Wouter Haverals and Lindsey Geybels in “A digital inquiry into the age of the implied readership of the Harry Potter series” (2021) used various statistical methods to examine whether the Harry Potter books did in fact progressively become more mature and adult with successive books, as often believed by literature scholars and reviewers. While they did find that the text of the books implied a more advanced reader with later books, the change was perhaps not as large as would be expected.

How can Scholarly Commons help?

If all of this is new to you, don’t worry! The Scholarly Commons can help you get started.

Here are various aspects of our data services in the Scholarly Commons:

As always, if you’re interested in learning more about data analysis and how to support your own projects you can fill out a consultation request form, attend a Savvy Researcher Workshop, Live Chat with us on Ask a Librarian, or send us an email. We are always happy to help!

Holiday Data Visualizations

The fall 2020 semester is almost over, which means that it is the holiday season again! We would especially like to wish everyone in the Jewish community a happy first night of Hanukkah tonight.

To celebrate the end of this semester, here are some fun Christmas and Hanukkah-related data visualizations to explore.

Popular Christmas Songs

First up, in 2018 data journalist Jon Keegan analyzed a dataset of 122 hours of airtime from a New York radio station in early December. He was particularly interested in discovering if there was a particular “golden age” of Christmas music, since nowadays it seems that most artists who release Christmas albums simply cover the same popular songs instead of writing a new song. This is a graph of what he discovered:

Based on this dataset, 65% of popular Christmas songs were originally released in the 1940s, 50s, and 60s. Despite the notable exception of Mariah Carey’s “All I Want for Christmas is You” from the 90s, most of the beloved “Holiday Hits” come from the mid-20th century.

As for why this is the case, the popular webcomic XKCD claims that every year American culture tries to “carefully recreate the Christmases of Baby Boomers’ childhoods.” Regardless of whether Christmas music reflects the enduring impact of the postwar generation on America, Keegan’s dataset is available online to download for further exploration.

Christmas Trees

Last year, Washington Post reporters Tim Meko and Lauren Tierney wrote an article about where Americans get their live Christmas trees from. The article includes this map:

The green areas are forests primarily composed of evergreen Christmas trees, and purple dots represent Choose-and-cut Christmas tree farms. 98% of Christmas trees in America are grown on farms, whether it’s a choose-and-cut farm where Americans come to select themselves or a farm that ships trees to stores and lots.

This next map shows which counties produce the most Christmas trees:

As you can see, the biggest Christmas tree producing areas are New England, the Appalachians, the Upper Midwest, and the Pacific Northwest, though there are farms throughout the country.

The First Night of Hanukkah

This year, Hanukkah starts tonight, December 10, but its start date varies every year. However, this is not the case on the primarily lunar-based Hebrew Calendar, in which Hanukkah starts on the 25th night of the month of Kislev. As a result, the days of Hanukkah vary year-to-year on other calendars, particularly the solar-based Gregorian calendar. It can occur as early as November 28 and as late as December 26.

In 2016, Hannukah began on December 24, Christmas Eve, so Vox author Zachary Crockett created this graphic to show the varying dates on which the first night of Hannukah has taken place from 1900 to 2016:

The Spelling of Hanukkah

Hanukkah is a Hebrew word, so as a result there is no definitive spelling of the word in the Latin alphabet I am using to write this blog post. In Hebrew it is written as חנוכה and pronounced hɑːnəkə in the phonetic alphabet.

According to Encyclopædia Britannica, when transliterating the pronounced word into English writing, the first letter ח, for example, is pronounced like the ch in loch. As a result, 17th century transliterations spell the holiday as Chanukah. However, ח does not sounds like the way ch does when its at the start of an English word, such as in chew, so in the 18th century the spelling Hanukkah became common. However, the H on its own is not quite correct either. More than twenty other spelling variations have been recorded due to various other transliteration issues.

It’s become pretty common to use Google Trends to discover which spellings are most common, and various journalists have explored this in past years. Here is the most recent Google search data comparing the two most commons spellings, Hanukkah and Chanukah going back to 2004:

You can also click this link if you are reading this article after December 2020 and want even more recent data.

As you would expect, the terms are more common every December. It warrants further analysis, but it appears that Chanukah is becoming less common in favor of Hanukkah, possibly reflecting some standardization going on. At some point, the latter may be considered the standard term.

You can also use Google Trends to see what the data looks like for Google searches in Israel:

Again, here is a link to see the most recent version of this data.

In Israel, it also appears as though the Hanukkah spelling is also becoming increasingly common, though early on there were years in which Chanukah was the more popular spelling.


I hope you’ve enjoyed seeing these brief explorations into data analysis related to Christmas and Hanukkah and the quick discoveries we made with them. But more importantly, I hope you have a happy and relaxing holiday season!