Biking at UIUC: the Creation of a StoryMap

The 651 total buildings owned by the University of Illinois at Urbana-Champaign stretch across an area of 9.9 square miles, or 6,370 acres. With a campus as large as ours, it’s no wonder the students, faculty, and staff use so many different means of transportation. Cars, bikes, skateboards, public transit, scooters – you name it!

When the weather is even halfway decent, you can find me biking around campus. It’s quick, convenient, and provides a bit of exercise in the otherwise sedentary life of a grad student. However, biking on campus is not without its frustrations. Bike routes are not always obvious, and sometimes they’re blocked by pedestrians or poorly parked cars. Even though I’ve gained more confidence in using bike lanes, it’s always a little nerve-wracking when I need to merge into traffic to turn left, or when a bus drives by and I’m stuck between it and a row of parked cars, the doors of which could open at any moment.
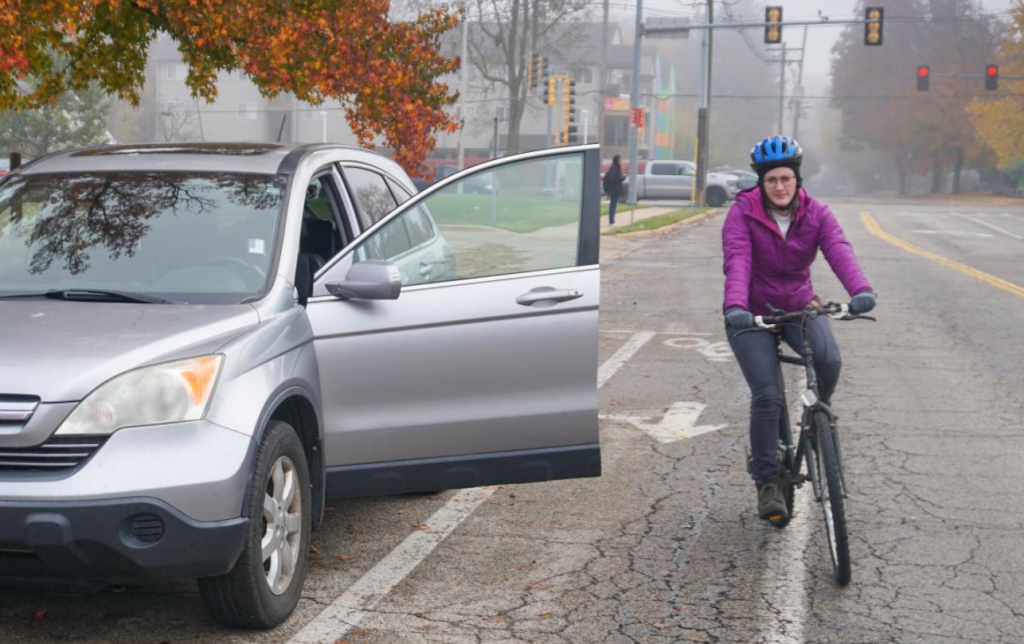
biker avoiding an open car door
photo by Dominik Stallings

With these concerns in mind, I set out to learn more about the different kinds of bike routes on campus and the safety pros and cons of each. I read various research articles and made observations of potential features or issues while biking around campus. I took photos of campus bike routes, including common bike lane hazards, some of which were staged for the sake of photography, but still very real issues. I learned about resources related to getting around campus, and wanted to further share them.

In order to present my research, which relied heavily on maps, I used ArcGIS StoryMaps. This software was well-suited to the needs of this project. I was able to get data on bike routes and parking areas from campus facilities, which I used to create web maps with ArcMap and ArcGIS Online so that viewers could see each type of bike route in isolation. Continuity of bike routes has been found to be an important factor in whether people choose to bike, and certain people may feel more or less comfortable using different types of routes, so I wanted to demonstrate how these comfort limitations affect route continuity, possibly leading to fewer people choosing to bike.
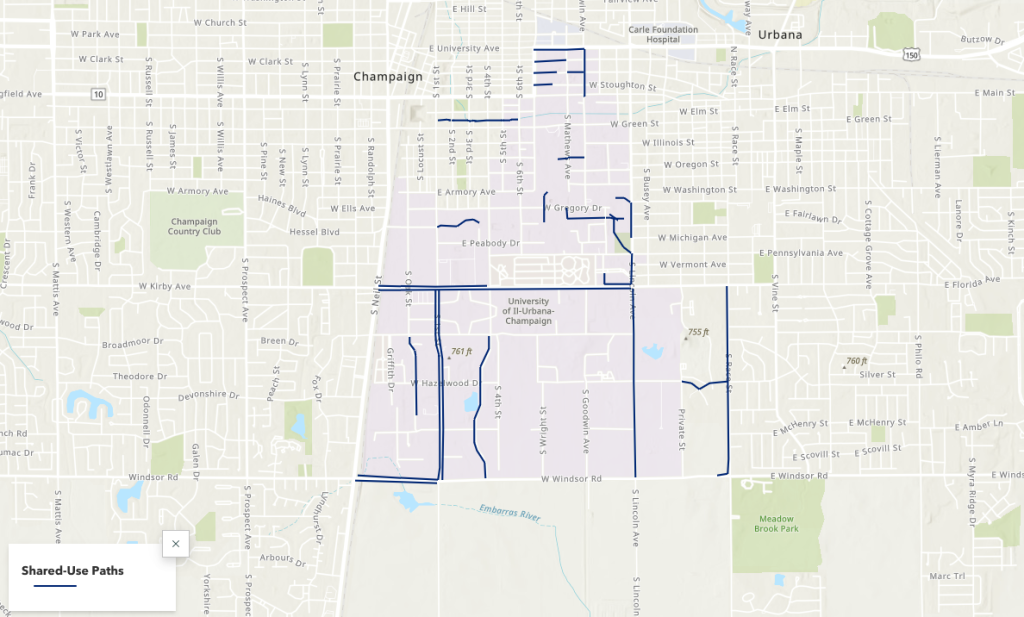
Screenshot of shared-use paths map

These maps, photos, and narrative elements came together to tell a story about biking on campus. To learn more about the campus bike network, the safety pros and cons of different bike route types, and campus navigation tips, you can explore the StoryMap here.

Of Maps and Memes: A Bit of Cartographic Fun

Co-Authored by Zhaneille Green

We use maps to communicate all the time. Historically, they have been used to navigate the world and to stand as visual, physical manifestations of defined spaces and places. What do you think of when we say “map”: a topographic map1 a transportation map2 or a city map3?

You can use maps to represent just about anything you want to say, far beyond these typical examples. We wrote this blog to invite you to have a little cartographic fun of your own.

If you’re on any kind of social media, you’ve probably seen maps like the one below, highlighting anything from each state’s favorite kind of candy to what the continental US would look like if all of the states’ borders were drawn along rivers and mountain ranges. People definitely seem to enjoy sharing these maps, curious to see what grocery store most people shop at in their home state, or laughing about California’s lack of popularity with the states in the surrounding area.

Map of most popular halloween candy in each US state. View the interactive version on candystore.com

Try your hand at creating your own silly map by using our programs in the Scholarly Commons. Start a war by creating a map that ranks the Southern states with the best barbecue using Adobe Photoshop or Illustrator, or explore a personal hobby like creating a map of all the creatures Sam & Dean Winchester met through the 15 seasons of Supernatural using ArcGIS.

If you’re feeling a bit more serious, don’t fret! Even if these meme-like maps aren’t portraying the most critical information, they do demonstrate how maps can be a great tool for data visualization. In many ways, location can make data feel more personal, because we all have personal connections to place. Admit it: the first thing you checked on the favorite candy map was your home state. Maps also tend to be more visually engaging than a simple table with, for example, states in one column and favorite animal in the other.

Using geotagging data, each dot represents where a photo was taken: blue for locals, red for tourists, and yellow for unknown. Locals and Tourists #1 (GTWA #2): London. Erica Fischer, CC BY-SA 2.0 via Flickr.

Regardless of what you want to map, the Scholarly Commons has the tools to help bring your vision to life. Learn about software access on our website, and check out these LinkedIn Learning resources for an introduction to ArcGIS Online or Photoshop, which are available with University of Illinois login credentials. If you need more assistance, feel free to ask us questions. Go forth and meme!

Introducing Drop-In Consultation Hours at the Scholarly Commons!

Do you have a burning question about data management, copyright, or even how to work Adobe Photoshop but do not have the time to set up an appointment? This semester, the Scholarly Commons is happy to introduce our new drop-in consultation hours! Each weekday, we will have an expert from a different scholarly subject have an open hour or two where you can bring any question you have about that’s expert’s specialty. These will all take place in room 220 in the Main Library in Group Room A (right next to the Scholarly Commons help desk). Here is more about each session:


Mondays 11 AM – 1 PM: Data Management with Sandi Caldrone

This is a photo of Sandi Caldrone, who works for Research Data Services and will be hosting the Monday consultation hours from 11 AM - 1 PMStarting us off, we have Sandi Caldrone from Research Data Services offering consultation hours on data management. Sandi can help with topics such as creating a data management plan, organizing/storing your data, data curation, and more. She can also help with questions around the Illinois Data Bank and the Dryad Repository.


Tuesdays 11 AM – 1 PM: GIS with Wenjie Wang

Next up, we have Wenjie Wang from the Scholarly Commons to offer consultation about Geographic Information Systems (GIS). Have a question about geocoding, geospatial analysis, or even where to locate GIS data? Wenjie can help! He can also answer any questions related to using ArcGIS or QGIS.


Wednesdays 11 AM – 12 PM: Copyright with Sara Benson

This is a photo of Copyright Librarian Sara Benson who will be hosting the Wednesday consultation hours from 11 AM - 12 PMDo you have questions relating to copyright and your dissertation, negotiating an author’s agreement, or seeking permission to include an image in your own work? Feel free to drop in during Copyright Librarian Sara Benson’s open copyright hours to discuss any copyright questions you may have.


Thursdays 1-3 PM: Qualitative Data Analysis with Jess Hagman

This is a photo of Jess Hagman, who works for the Social Science, Education, and Health Library and will be hosting the Thursday consultation hours from 1 PM - 3 PMJess Hagman from the Social Science, Health, and Education Library is here to help with questions related to performing qualitative data analysis (QDA). She can walk you through any stage of the qualitative data analysis process regardless of data or methodology. She can also assist in operating QDA software including NVivo, Atlas.ti, MAXQDA, Taguette, and many more! For more information, you can also visit the qualitative data analysis LibGuide.


Fridays 10 AM – 12 PM: Graphic Design and Multimedia with JP Goguen

To end the week, we have JP Goguen from the Scholarly/Media Commons with consultation hours related to graphic design and multimedia. Come to JP with any questions you may have about design or photo/video editing. You can also bring JP any questions related to software found on the Adobe Creative Cloud (such as Photoshop, InDesign, Premiere Pro, etc.).


Have another Scholarly Inquiry?

If there is another service you need help with, you are always welcome to stop by the Scholarly Commons help desk in room 220 of the Main Library between 10 AM – 6 PM Monday-Friday. From here, we can get you in contact with another specialist to guide you through your research inquiry. Whatever your question may be, we are happy to help you!

Tomorrow! Big Ten Academic Alliance GIS Conference 2020

Save the date! Tomorrow is the Big Ten Academic Alliance (BTAA) GIS Conference 2020. This event is 100% virtual and free of charge to anyone who wants to engage with the community of GIS specialists and researchers from Big Ten institutions.

The conference kicks off tonight with a GIS Day Trivia Night event at 5:30PM CST! There is a Map Gallery that is open to view from now until November 13th, 2020. The gallery features research that incorporates GIS from Big Ten institutions, so be sure to check it out! There will be lighting talks, presentations, social hours, and a keynote address from Dr. Orhun Aydin, Senior Researcher at Esri, so be sure to check out the full schedule of events and register here.

This event is a great way to network and learn more applications of GIS for research. If you are interested in GIS but don’t know where to start, this event is a great place to get inspired. If you are an experienced GIS researcher, this event is an opportunity to meet colleagues and learn from your peers. Overall this is a great event for anyone interested in GIS and the perfect way to start Geography Awareness Week, which goes from November 15th-21st this year!

GIS Resources for Distance Learning and Working from Home

Planet Earth wearing a doctor's maskThe past couple of weeks have been a whirlwind for everyone as we’ve all sought to adjust to working, attending school, socializing, and just carrying out our daily lives online. Here at the Scholarly Commons, we’ve been working hard to ensure that this transition is as smooth as possible for those of you relying on specialized software to conduct your research or do your classwork. That’s why this week we wanted to highlight some resources essential to anyone using or teaching with GIS as we work through this period of social distancing. 

Continue reading