There’s been a Murder in SQL City!

by Libby Cave
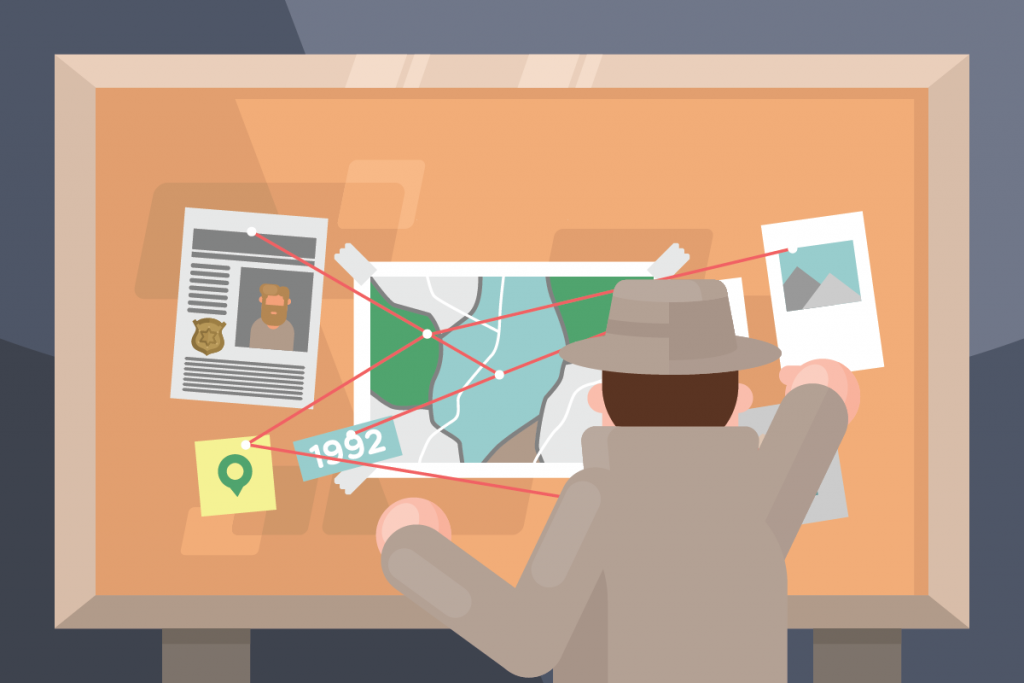
Detective faces board with files, a map and pictures connected with red string.

If you are interested in data or relational databases, then you have heard of SQL. SQL, or Structured Query Language, is designed to handle structured data in order to assist in data query, data manipulation, data definition and data access control. It is a very user-friendly language to learn with a simple code structure and minimal use of special characters. Because of this, SQL is the industry standard for database management, and this is reflected in the job market as there is a strong demand for employees with SQL skills.  

Enter SQL Murder Mystery

In an effort to promote the learning of this valuable language, Knight Labs, a specialized subsidiary of Northwestern University, created SQL Murder Mystery. Combining the known benefits of gamification and the popularity of whodunit detective work, SQL Murder Mystery aims to help SQL beginners become familiar with the language and have some fun with a normally dry subject. Players take on the role of a gumshoe detective tasked with solving a murder. The problem is you have misplaced the crime scene report and you now must dive into the police department’s database to find the clues. For true beginners with no experience, the website provides a walkthrough to help get players started. More experienced learners can jump right in and practice their skills. 

I’m on the case!

I have no experience with SQL but I am interested in database design and information retrieval, so I knew it was high time that I learn the basics. As a fan of both games and detective stories, SQL Murder Mystery seemed like a great place to start. Since I am a true beginner, I started with the walkthrough. As promised on the website, this walkthrough did not give me a complete, exhaustive introduction to SQL as a language, but instead gave me the tools needed to get started on the case. SQL as a language, relational databases and Entity Relationship Diagrams (ERD) were briefly explained in an approachable manner. In the walk through, I was introduced to vital SQL functions like “Select:, “Where”, wildcards, and “Between”. My one issue with the game was in the joining tables section. I learned later that the reason I was having issues was due to the tables each having columns with the same title, which is apparently a foundational SQL feature. The guide did not explain that this could be an issue and I had to do some digging on my own to find out how to fix it. It seems like the walkthrough should have anticipated this issue and mentioned it. That aside, By the end of the walkthrough, I could join tables, search for partial information matches, and search within ranges. With some common sense, the database’s ERD, and the new SQL coding skills, I was able to solve the crime! If users weren’t challenged enough with that task, there is an additional challenge that suggests users find the accomplice while only using 2 queries.
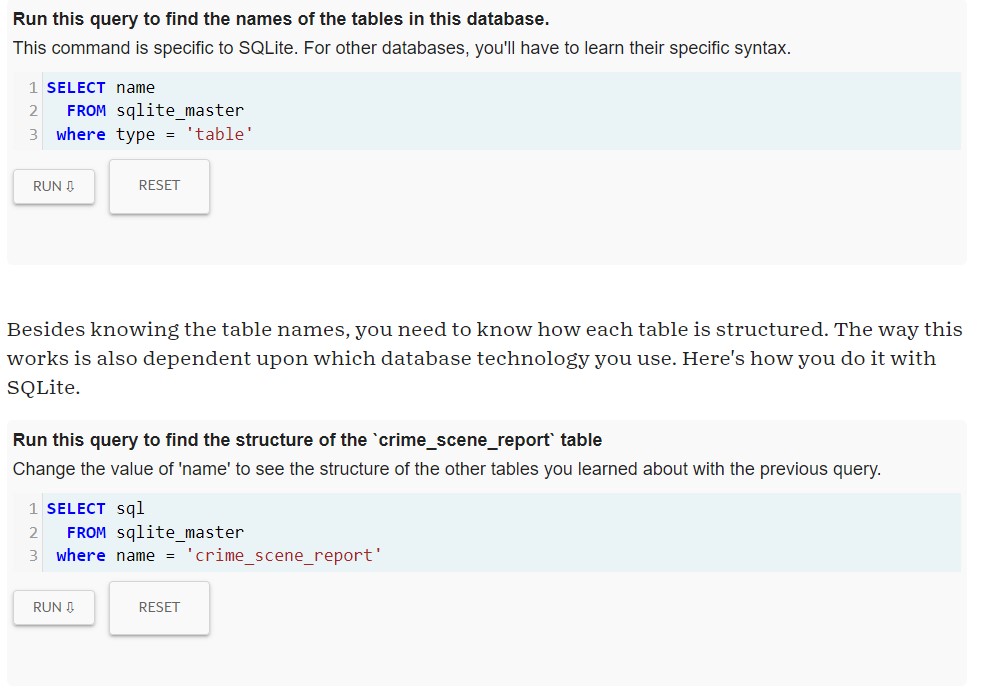
User interface of SQL Murder Mystery
Example of SQL Murder Mystery user interface

The Verdict is In

I really loved this game! It served as a great introduction to a language I had never used before but still managed to be really engaging. It reminded me of those escape room mystery boxes like Hunt a Killer that has users solve puzzles to get to a larger final solution. Anyone who loves logic puzzles or mysteries will enjoy this game, even if they have no experience with or even interest in coding or databases.  If you have some free time and a desire to explore a new skill, you should absolutely give SQL Murder Mystery a try!

Introducing Drop-In Consultation Hours at the Scholarly Commons!

Do you have a burning question about data management, copyright, or even how to work Adobe Photoshop but do not have the time to set up an appointment? This semester, the Scholarly Commons is happy to introduce our new drop-in consultation hours! Each weekday, we will have an expert from a different scholarly subject have an open hour or two where you can bring any question you have about that’s expert’s specialty. These will all take place in room 220 in the Main Library in Group Room A (right next to the Scholarly Commons help desk). Here is more about each session:


Mondays 11 AM – 1 PM: Data Management with Sandi Caldrone

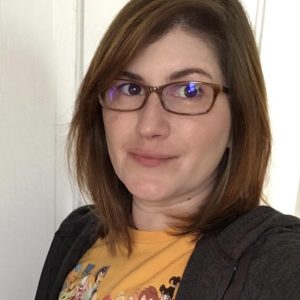
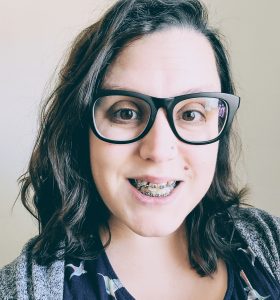
This is a photo of Sandi Caldrone, who works for Research Data Services and will be hosting the Monday consultation hours from 11 AM - 1 PMStarting us off, we have Sandi Caldrone from Research Data Services offering consultation hours on data management. Sandi can help with topics such as creating a data management plan, organizing/storing your data, data curation, and more. She can also help with questions around the Illinois Data Bank and the Dryad Repository.


Tuesdays 11 AM – 1 PM: GIS with Wenjie Wang

Next up, we have Wenjie Wang from the Scholarly Commons to offer consultation about Geographic Information Systems (GIS). Have a question about geocoding, geospatial analysis, or even where to locate GIS data? Wenjie can help! He can also answer any questions related to using ArcGIS or QGIS.


Wednesdays 11 AM – 12 PM: Copyright with Sara Benson

This is a photo of Copyright Librarian Sara Benson who will be hosting the Wednesday consultation hours from 11 AM - 12 PMDo you have questions relating to copyright and your dissertation, negotiating an author’s agreement, or seeking permission to include an image in your own work? Feel free to drop in during Copyright Librarian Sara Benson’s open copyright hours to discuss any copyright questions you may have.


Thursdays 1-3 PM: Qualitative Data Analysis with Jess Hagman

This is a photo of Jess Hagman, who works for the Social Science, Education, and Health Library and will be hosting the Thursday consultation hours from 1 PM - 3 PMJess Hagman from the Social Science, Health, and Education Library is here to help with questions related to performing qualitative data analysis (QDA). She can walk you through any stage of the qualitative data analysis process regardless of data or methodology. She can also assist in operating QDA software including NVivo, Atlas.ti, MAXQDA, Taguette, and many more! For more information, you can also visit the qualitative data analysis LibGuide.


Fridays 10 AM – 12 PM: Graphic Design and Multimedia with JP Goguen

To end the week, we have JP Goguen from the Scholarly/Media Commons with consultation hours related to graphic design and multimedia. Come to JP with any questions you may have about design or photo/video editing. You can also bring JP any questions related to software found on the Adobe Creative Cloud (such as Photoshop, InDesign, Premiere Pro, etc.).


Have another Scholarly Inquiry?

If there is another service you need help with, you are always welcome to stop by the Scholarly Commons help desk in room 220 of the Main Library between 10 AM – 6 PM Monday-Friday. From here, we can get you in contact with another specialist to guide you through your research inquiry. Whatever your question may be, we are happy to help you!

Introductions: What is Data Analysis, anyway?

This post is part of a series where we introduce you to the various topics that we cover in the Scholarly Commons. Maybe you’re new to the field or you’re just to the point where you’re just too afraid to ask… Fear not! We are here to take it back to the basics!

So, what is Data Analysis, anyway?

Data analysis is the process of examining, cleaning, transforming, and modeling data in order to make discoveries and, in many cases, support decision making. One key part of the data analysis process is separating the signal (meaningful information you are trying to discover) from the noise (random, meaningless variation) in the data.

The form and methods of data analysis can vary widely, and some form of data analysis is present in nearly every academic field. Here are some examples of data analysis projects:

  • Taylor Arnold, Lauren Tilton, and Annie Berke in “Visual Style in Two Network Era Sitcoms” (2019) used large-scale facial recognition and image analysis to examine the centrality of characters in the 1960s sitcoms Bewitched and I Dream of Jeannie. They found that Samantha is the distinctive lead character of Bewitched, while Jeannie is positioned under the domination of Tony in I Dream of Jeannie.
  • Allen Kim, Charuta Pethe, Steven Skiena in “What time is it? Temporal Analysis of Novels(2020) used the full text of 52,183 fiction books from Project Gutenberg and the HaithiTrust to examine the time of day that events in the book took place during. They found that events from 11pm to 1am became more common after 1880, which the authors attribute to the invention of electric lighting.
  • Wouter Haverals and Lindsey Geybels in “A digital inquiry into the age of the implied readership of the Harry Potter series” (2021) used various statistical methods to examine whether the Harry Potter books did in fact progressively become more mature and adult with successive books, as often believed by literature scholars and reviewers. While they did find that the text of the books implied a more advanced reader with later books, the change was perhaps not as large as would be expected.

How can Scholarly Commons help?

If all of this is new to you, don’t worry! The Scholarly Commons can help you get started.

Here are various aspects of our data services in the Scholarly Commons:

As always, if you’re interested in learning more about data analysis and how to support your own projects you can fill out a consultation request form, attend a Savvy Researcher Workshop, Live Chat with us on Ask a Librarian, or send us an email. We are always happy to help!

An Introduction to Traditional Knowledge Labels and Licenses

NOTE: While we are discussing matters relating to the law, this post is not meant as legal advice.

Overview

Fans of Mukurtu CMS, a digital archeology platform, as well as intellectual property nerds may already be familiar with Traditional Knowledge labels and licenses, but for everyone else here’s a quick introduction. Traditional Knowledge labels and licenses, were specifically created for researchers and artists working with or thinking of digitizing materials created by indigenous groups. Although created more educational, rather than legal value, these labels aim to allow indigenous groups to take back some control over their cultural heritage and to educate users about how to incorporate these digital heritage items in a more just and culturally sensitive way. The content that TK licenses and labels cover extends beyond digitized visual arts and design to recorded and written and oral histories and stories. TK licenses and labels are also a standard to consider when working with any cultural heritage created by marginalized communities. They also provide an interesting way to recognize ownership and the proper use of work that is in the public domain. These labels and licenses are administered by Local Contexts, an organization directed by Jane Anderson, a professor at New York University and Kim Christen, a professor at Washington State University. Local Contexts is dedicated to helping Native Americans and other indigenous groups gain recognition for, and control over, the way their intellectual property is used. This organization has received funding from sources including the National Endowment for Humanities, and the World Intellectual Property Organization.

Traditional knowledge, or TK, labels and licenses are a way to incorporate protocols for cultural practices into your humanities data management and presentation strategies. This is especially relevant because indigenous cultural heritage items are traditionally viewed by Western intellectual property laws as part of the public domain. And, of course, there is a long and troubling history of dehumanizing treatment of Native Americans by American institutions, as well as a lack of formal recognition of their cultural practices, which is only starting to be addressed. Things have been slowly improving; for example, the Native American Graves and Repatriation Act of 1990 was a law specifically created to address institutions, such as museums, which owned and displayed people’s relative’s remains and related funerary art without their permission or the permission of their surviving relatives (McManamon, 2000). The World Intellectual Property Organization’s Intergovernmental Committee on Intellectual Property and Genetic Resources, Traditional Knowledge and Folklore (IGC) has began to address and open up conversations about these issues in hopes of coming up with a more consistent legal framework for countries to work with; though, confusingly, most of what Traditional Knowledge labels and licenses apply to are considered “Traditional Cultural Expressions” by WIPO (“Frequently Asked Questions,” n.d.).

To see these labels and licenses in action, take a look at how how these are used is the Mira Canning Stock Route Project Archive from Australia (“Mira Canning Stock Route Project Archive,” n.d.).

The main difference between TK labels and licenses is that TK labels are an educational tool for suggested use with indigenous materials, whether or not they are legally owned by an indigenous community, while TK licenses are similar to Creative Commons licenses — though less recognized — and serve as a customizable supplement to traditional copyright law for materials owned by indigenous communities (“Does labeling change anything legally?,” n.d.).

The default types of TK licenses are: TK Education, TK Commercial, TK Attribution, TK Noncommercial.

Four proposed TK licenses

TK Licenses so far (“TK Licenses,” n.d.)

Each license and label, as well as a detailed description can be found on the Local Contexts site and information about each label is available in English, French, and Spanish.

The types of TK labels are: TK Family, TK Seasonal, TK Outreach, TK Verified, TK Attribution, TK Community Use Only, TK Secret/Sacred, TK Women General, TK Women Restricted, TK Men General, TK Men Restricted, TK Noncommercial, TK Commercial, TK Community Voice, TK Culturally Sensitive (“Traditional Knowledge (TK) Labels,” n.d.).

Example:

TK Women Restricted (TK WR) Label

A TK Women Restricted Label.

“This material has specific gender restrictions on access. It is regarded as important secret and/or ceremonial material that has community-based laws in relation to who can access it. Given its nature it is only to be accessed and used by authorized [and initiated] women in the community. If you are an external third party user and you have accessed this material, you are requested to not download, copy, remix or otherwise circulate this material to others. This material is not freely available within the community and it therefore should not be considered freely available outside the community. This label asks you to think about whether you should be using this material and to respect different cultural values and expectations about circulation and use.” (“TK Women Restricted (TK WR),” n.d.)

Wait, so is this a case where a publicly-funded institution is allowed to restrict content from certain users by gender and other protected categories?

The short answer is that this is not what these labels and licenses are used for. Local Contexts, Mukurtu, and many of the projects and universities associated with the Traditional Knowledge labels and licensing movement are publicly funded. From what I’ve seen, the restrictions are optional, especially for those outside the community (“Does labeling change anything legally?,” n.d.). It’s more a way to point out when something is meant only for members of a certain gender, or to be viewed during a time of year, than to actually restrict something only to members of a certain gender. In other words, the gender-based labels for example are meant for the type of self-censorship of viewing materials that is often found in archival spaces. That being said, some universities have what is called a Memorandum of Understanding between a university and an indigenous community, which involve universities agreeing to respect the Native American culture. The extent to which this goes for digitized cultural heritage held in university archives, for example, is unclear, though most Memorandum of Understanding are not legally binding (“What is a Memorandum of Understanding or Memorandum of Agreement?,” n.d.) . Overall, this raises lots of interesting questions about balancing conflicting views of intellectual property and access and public domain.

Works Cited:

Does labeling change anything legally? (n.d.). Retrieved August 3, 2017, from http://www.localcontexts.org/project/does-labeling-change-anything-legally/
Frequently Asked Questions. (n.d.). Retrieved August 3, 2017, from http://www.wipo.int/tk/en/resources/faqs.html
McManamon, F. P. (2000). NPS Archeology Program: The Native American Graves Protection and Repatriation Act (NAGPRA). In L. Ellis (Ed.), Archaeological Method and Theory: An Encyclopedia. New York and London: Garland Publishing Co. Retrieved from https://www.nps.gov/archeology/tools/laws/nagpra.htm
Mira Canning Stock Route Project Archive. (n.d.). Retrieved August 3, 2017, from http://mira.canningstockrouteproject.com/
TK Licenses. (n.d.). Retrieved August 3, 2017, from http://www.localcontexts.org/tk-licenses/
TK Women Restricted (TK WR). (n.d.). Retrieved August 3, 2017, from http://www.localcontexts.org/tk/wr/1.0
What is a Memorandum of Understanding or Memorandum of Agreement? (n.d.). Retrieved August 3, 2017, from http://www.localcontexts.org/project/what-is-a-memorandum-of-understandingagreement/

Further Reading:

Christen, K., Merrill, A., & Wynne, M. (2017). A Community of Relations: Mukurtu Hubs and Spokes. D-Lib Magazine, 23(5/6). https://doi.org/10.1045/may2017-christen
Educational Resources. (n.d.). Retrieved August 3, 2017, from http://www.localcontexts.org/educational-resources/
Lord, P. (n.d.). Unrepatriatable: Native American Intellectual Property and Museum Digital Publication. Retrieved from http://www.academia.edu/7770593/Unrepatriatable_Native_American_Intellectual_Property_and_Museum_Digital_Publication
Project Description. (n.d.). Retrieved August 3, 2017, from http://www.sfu.ca/ipinch/about/project-description/

Acknowledgements:

Thank you to the Rare Book and Manuscript Library and Melissa Salrin in the iSchool for helping me with my questions about indigenous and religious materials in archives and special collections at public institutions, you are the best!

Scholarly Smackdown: StoryMap JS vs. Story Maps

In today’s very spatial Scholarly Smackdown post we are covering two popular mapping visualization products, Story Maps and StoryMap JS.Yes they both have “story” and “map” in the name and they both let you create interactive multimedia maps without needing a server. However, they are different products!

StoryMap JS

StoryMap JS, from the Knight Lab at Northwestern, is a simple tool for creating interactive maps and timelines for journalists and historians with limited technical experience.

One  example of a project on StoryMap JS is “Hockey, hip-hop, and other Green Line highlights” by Andy Sturdevant for the Minneapolis Post, which connects the stops of the Green Line train to historical and cultural sites of St. Paul and Minneapolis Minnesota.

StoryMap JS uses Google products and map software from OpenStreetMap.

Using the StoryMap JS editor, you create slides with uploaded or linked media within their template. You then search the map and select a location and the slide will connect with the selected point. You can embed your finished map into your website, but Google-based links can deteriorate over time! So save copies of all your files!

More advanced users will enjoy the Gigapixel mode which allows users to create exhibits around an uploaded image or a historic map.

Story Maps

Story maps is a custom map-based exhibit tool based on ArcGIS online.

My favorite example of a project on Story Maps is The Great New Zealand Road Trip by Andrew Douglas-Clifford, which makes me want to drop everything and go to New Zealand (and learn to drive). But honestly, I can spend all day looking at the different examples in the Story Maps Gallery.

Story Maps offers a greater number of ways to display stories than StoryMap JS, especially in the paid version. The paid version even includes a crowdsourced Story Map where you can incorporate content from respondents, such as their 2016 GIS Day Events map.

With a free non-commercial public ArcGIS Online account you can create a variety of types of maps. Although it does not appear there is to overlay a historical map, there is a comparison tool which could be used to show changes over time. In the free edition of this software you have to use images hosted elsewhere, such as in Google Photos. Story Maps are created through their wizard where you add links to photos/videos, followed by information about these objects, and then search and add the location. It is very easy to use and almost as easy as StoryMap JS. However, since this is a proprietary software there are limits to what you can do with the free account and perhaps worries about pricing and accessing materials at a later date.

Overall, can’t really say there’s a clear winner. If you need to tell a story with a map, both software do a fine job, StoryMap JS is in my totally unscientific opinion slightly easier to use, but we have workshops for Story Maps here at Scholarly Commons!  Either way you will be fine even with limited technical or map making experience.

If you are interested in learning more about data visualization, ArcGIS Story Maps, or geopatial data in general, check out these upcoming workshops here at Scholarly Commons, or contact our GIS expert, James Whitacre!

Love and Big Data

Can big data help you find true love?

It’s Love Your Data Week, but did you know people have been using Big Data for to optimize their ability to find their soul mate with the power of data science! Wired Magazine profiled mathematician and data scientist Chris McKinlay in “How to Hack OkCupid“.There’s even a book spin-off from this! “Optimal Cupid”, which unfortunately is not at any nearby libraries.

But really, we know you’re all wondering, where can I learn the data science techniques needed to find “The One”, especially if I’m not a math genius?

ETHICS NOTE: WE DO NOT ENDORSE OR RECOMMEND TRYING TO CREATE SPYWARE, ESPECIALLY NOT ON COMPUTERS IN THE SPACE. WE ALSO DON’T GUARANTEE USING BIG DATA WILL HELP YOU FIND LOVE.

What did Chris McKinlay do?

Methods used:

  • Automating tasks, such as writing a python script to answer questions on OKCupid
  • Scraping data from dating websites
  • Surveying
  • Statistical analysis
  • Machine learning to figure out how to rank the importance of answers of questions
  • Bots to visit people’s pages
  • Actually talking to people in the real world!

Things we can help you with at Scholarly Commons:

Selected workshops and resources, come by the space to find more!

Whether you reach out to us by email, phone, or in-person our experts are ready to help with all of your questions and helping you make the most of your data! You might not find “The One” with our software tools, but we can definitely help you have a better relationship with your data!

Getting Started With Paperpile

Did the Paperpile Review leave you interested in learning more?

To use Paperpile you need an Internet connection, Google Chrome, and a Google account. Since student/personal use accounts do not require a dot edu email, I recommend using your Google Apps @ Illinois account  for this because you can fully use and enjoy unlimited free storage from Google to store your PDFs. Paperpile offers one month free; afterwards, it’s $36 for the year. You can download the extension for Chrome here. If you already use Mendeley or Zotero you can import all of your files and information from these programs to Paperpile. In order to use Paperpile, you will need the app on each version of Chrome you use. It should sync as part of your Chrome extensions, and you can install it on Chrome on University Library computers as well.

You can import PDFs and metadata by clicking on the Paperpile logo on Chrome.

Paperpile import tool located just right of the search bar in Chrome

On your main page you can create folders, tag items, and more! You can also search for new articles in the app itself.

Paperpile Main Menu

If you didn’t import enough information about a source or it didn’t import the correct information you can easily add more details by clicking the check mark next to the document in the menu and clicking edit on the top menu next to the search box for your papers.

Paperpile

Plus, from the main page, when you click “View PDF” you can also use the beta annotations feature by clicking the pen icon. This feature lets you highlight and comment on your PDF and it saves the highlighted text and comments in order by page in notes. It can then be exported as plain text or as very pretty printouts. It is rectangle-based highlighting and can be a little bit annoying, especially when highlighting doesn’t always covered the text that was copied. Like a highlighter in real life you cannot continue to highlight onto the next page.

Highlighted and copied sentence split by page boundary

When you leave the app, the highlighting is saved on the PDF in your Google Drive and you can your highlights on the PDF wherever you use Google Drive. The copied text and comments can be exported into a very pretty printout or a variety of plaintext file formats.

Print screen of exported annotated notes on Paperpile

Not the prettiest example but you get the idea.

Once you get to actually writing your paper you can add citations to your paper in Google docs by clicking the Paperpile tab on your Google doc. You can search your library or the web for a specific article. Click format citations and follow the instructions for how to download the add-on for Google docs.

Paperpile cite while you write in Google Docs

I didn’t try it but there’s a Google Docs sidebar so that anyone can add references, regardless of whether or not they are a Paperpile user, to a Google Doc. I imagine this is great for those group projects where the “group” is not just the person who cares the most.


Troubleshooting

Paperpile includes a support chat box, which is located on your main page, and is very useful for troubleshooting. For example, one problem I ran into with Paperpile is that you cannot change the page number to match what it actually is in the article and page number is based on the PDF file in the notes feature. I messaged and  I got a response with a professional tone within twenty-four hours. Turns out, they are working on this problem and eventually PDFs will be numbered by actual page number, but they can’t say when they will have it fixed.

For other problems, there is an official help page  with a lot of instructions about using the software and answers to frequently asked questions. There is also a blog and a  forum which is particularly nice because you can see if other people are experiencing the same problem and what the company plans to do about it.

Scholarly Commons runs a variety of Savvy Researcher workshops throughout the year including personal information management and citation managers. And let us know in the comments about your favorite citation/reference management software and your way of keeping your research organized!

And for the curious, the examples in this post are based from the undergraduate research collection in IDEALS. Specifically:

Kountz, Erik. 2013. “Cascades of Cacophony.” Equinox Literary and Arts Magazine. http://hdl.handle.net/2142/89474.

Liao, Ethel. 2013. “Nutella, Dear Nutella.” Equinox Literary and Arts Magazine. http://hdl.handle.net/2142/89476.

Montesinos, Gary. 2015. “The Invisible (S)elf: Identity in House Elves and Harry Potter.” Re:Search: The Undergraduate Literary Criticism Journal 2 (1). http://hdl.handle.net/2142/78004.

Meet Elizabeth Wickes, Data Curation Specialist

colossusselfie

Elizabeth with a rebuilt and functional Colossus computer at the British National Museum of Computing.

This post is the third in our series profiling the expertise housed in the Scholarly Commons and our affiliate units in the University Library. Today we are featuring Elizabeth Wickes, Data Curation Specialist.


What is your background education and work experience?

I started in psychology and then moved to sociology. I also have a secretarial certificate and I use that training a lot! I worked at Wolfram Research as a Project Manager and then Curation Manager before I started library school.

What led you to this field?

Data curation just finds you. It’s a path where people with certain interests find themselves in.

What is your research agenda?

I’m exploring new and innovative ways to teach data management skills, especially computational research skills that normalize and practice defensive data management skills.

Do you have any favorite work-related duties?

My favorite thing to do is leading workshops and teaching. I really love listening to people’s research and helping them do it better. It’s great hearing about lots of different fields of research. It’s really important to me that I’m not stuck in a single college or field, that we’re a resource for the whole university.

What are some of your favorite underutilized resources that you would recommend to researchers?

I think consultation services in library are underutilized, including consultation for personalized data management.

If you could recommend only one book to beginning researchers in your field, what would you recommend?

Where Wizards Stay Up Late by Katie Hafner and Matthew Lyon. It’s a book all librarians should read, and it would be great for undergraduate reading, too. It’s the history of how the internet was born, explained through biographies of the key players. The book also covers the social and political situation at the time which was really interesting. It’s fascinating that this part of the world (the internet, data curation, etc.) was developed by people who were in college before this was a major or a field of study.

There are a lot of statistics out there about how much data we are producing now: For example: “Data production will be 44 times greater in 2020 than it was in 2009” and “More data has been created in the past two years than in the entire previous history of the human race”… How do you feel about the increase in big data?

Excited. When people ask me “What is big data?” I tell them that there’s a technological answer and a philosophical answer. The philosophical answer is that we no longer have to have a sampling strategy because we can get it all. We can just look at everything. From a data curation and organizational perspective it’s terrifying because there’s so much of it, but exciting.


To learn more about Research Data Service, you can visit their website. Elizabeth also holds Data Help Desk Drop-In Hours in the Scholarly Commons, every Tuesday from about 3:15-5 pm. To get in touch with Elizabeth, you can reach her by email.

Data Cite – Find, Identify, and Cite Datasets

Data Cite a non-profit organization created to establish easier access to research data,  increase acceptance of research data as legitimate, citable contributions to the scholarly record, and support data archiving.  This organization seeks to bring institutions, researchers and other interested groups together to address the challenges of making research data accessible and visible.  Through collaboration, researchers find support in locating, identifying, and citing research datasets with confidence.

Data Centers are provided persistent identifiers for datasets, plus workflows and standards for data publication. Journal publishers receive support to enable research articles to be linked with data.  Data Cite works with organizations, data centers, and libraries that host data in efforts to assign persistent identifiers to data sets.

Data citation is important for data re-use, verification and tracking.  Citable datasets become legitimate contributions to scholarly communication, paving the way for new metrics and publication models that recognize and reward data sharing. More information on  DataCite services, resources and events can be found  https://www.datacite.org/.