Biking at UIUC: the Creation of a StoryMap

The 651 total buildings owned by the University of Illinois at Urbana-Champaign stretch across an area of 9.9 square miles, or 6,370 acres. With a campus as large as ours, it’s no wonder the students, faculty, and staff use so many different means of transportation. Cars, bikes, skateboards, public transit, scooters – you name it!

When the weather is even halfway decent, you can find me biking around campus. It’s quick, convenient, and provides a bit of exercise in the otherwise sedentary life of a grad student. However, biking on campus is not without its frustrations. Bike routes are not always obvious, and sometimes they’re blocked by pedestrians or poorly parked cars. Even though I’ve gained more confidence in using bike lanes, it’s always a little nerve-wracking when I need to merge into traffic to turn left, or when a bus drives by and I’m stuck between it and a row of parked cars, the doors of which could open at any moment.
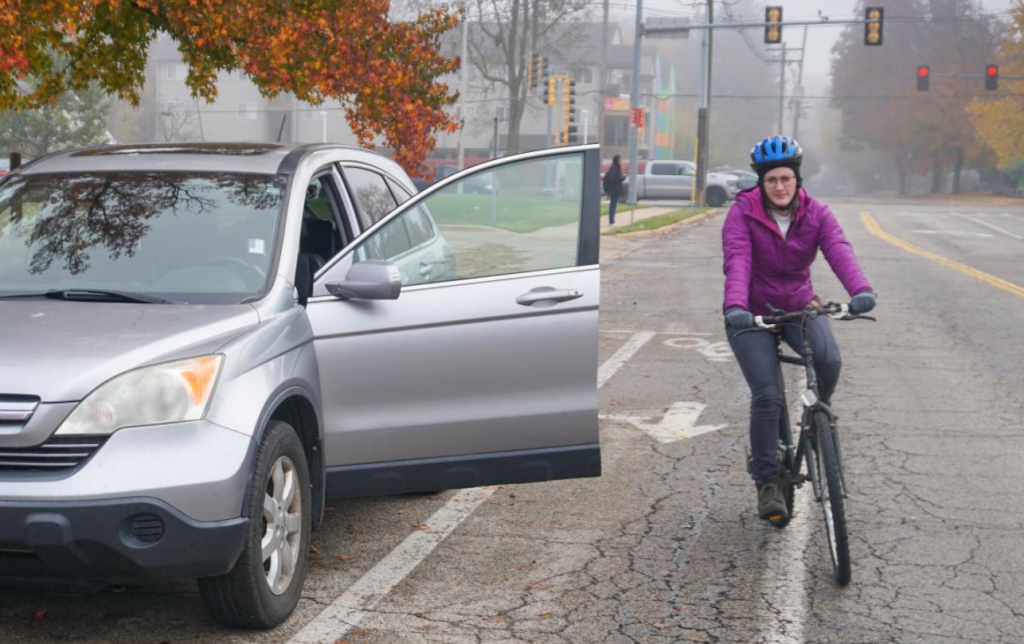
biker avoiding an open car door
photo by Dominik Stallings

With these concerns in mind, I set out to learn more about the different kinds of bike routes on campus and the safety pros and cons of each. I read various research articles and made observations of potential features or issues while biking around campus. I took photos of campus bike routes, including common bike lane hazards, some of which were staged for the sake of photography, but still very real issues. I learned about resources related to getting around campus, and wanted to further share them.

In order to present my research, which relied heavily on maps, I used ArcGIS StoryMaps. This software was well-suited to the needs of this project. I was able to get data on bike routes and parking areas from campus facilities, which I used to create web maps with ArcMap and ArcGIS Online so that viewers could see each type of bike route in isolation. Continuity of bike routes has been found to be an important factor in whether people choose to bike, and certain people may feel more or less comfortable using different types of routes, so I wanted to demonstrate how these comfort limitations affect route continuity, possibly leading to fewer people choosing to bike.
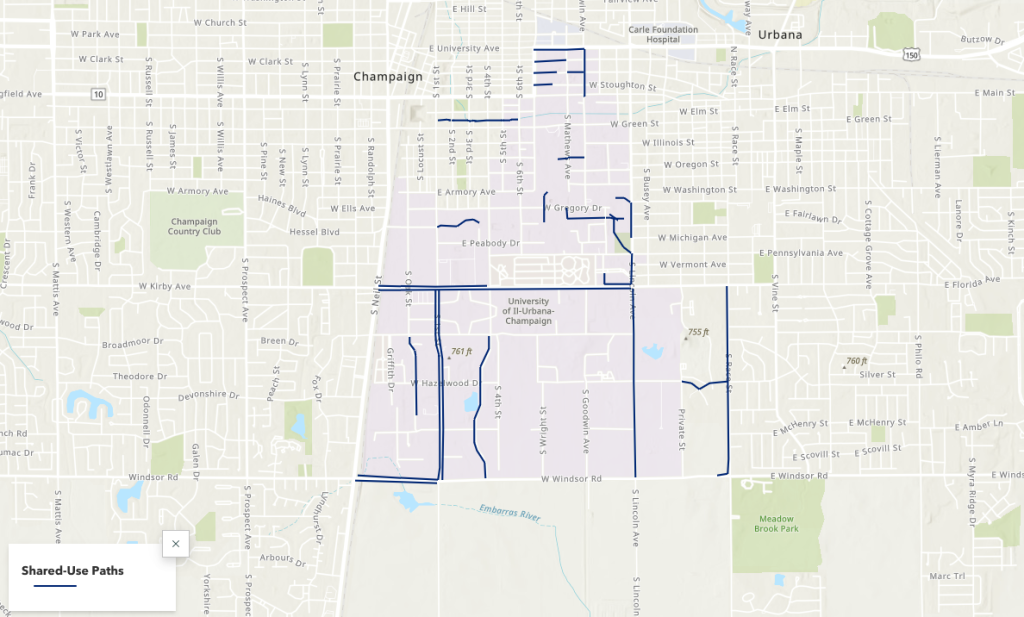
Screenshot of shared-use paths map

These maps, photos, and narrative elements came together to tell a story about biking on campus. To learn more about the campus bike network, the safety pros and cons of different bike route types, and campus navigation tips, you can explore the StoryMap here.

Explore the Possibilities with ArcGIS StoryMaps

ArcGIS StoryMaps is a handy tool for combining narrative, images, and maps to present information in an engaging way. Organizations have used StoryMaps for everything from celebrating their conservation achievements on their 25th anniversary to exploring urban diversity in Prague. The possibilities are vast, which can be both exciting and intimidating for people who are just getting started. I want to share some of my favorite StoryMap examples, which will demonstrate how certain StoryMap tools can be used and hopefully provide inspiration for your project.

A Homecoming for Gonarezhou’s Black Rhinos

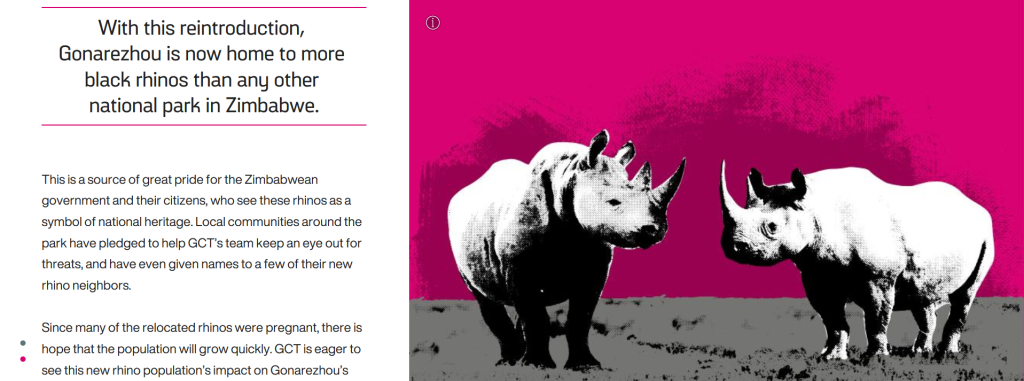
Screenshot of a storymap with text about and an image of rhinos.

If GIS and map creation are a bit outside your wheel-house, no worries! A Homecoming for Gonarezhou’s Black Rhinos is a StoryMap created by the Rhino Recovery Fund that is a great example of how a StoryMap can be made without using any maps. It’s also a good example of the timeline feature as well as making great use of a custom theme by incorporating the nonprofit’s signature pink into the story’s design.

Sounds of the Wild West

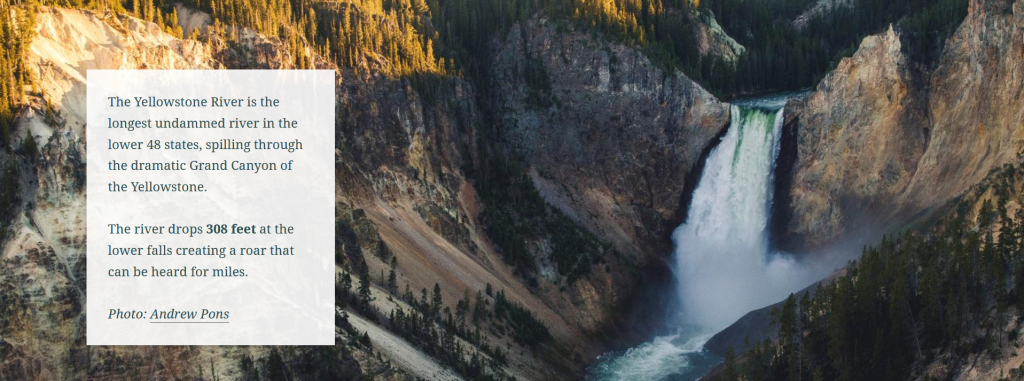
Screenshot of a storymap with text about and an image of the Yellowstone River.

Sounds of the Wild West is a StoryMap created by Acoustic Atlas that takes you on an audio tour of four different Montana ecosystems. This StoryMap is a lovely example of how powerful images and audio can immerse people in a location, enhancing their understanding of the information presented. The authors also made great use of the StoryMap sidecar, layering text, images, and audio to create their tour.

California’s Superbloom

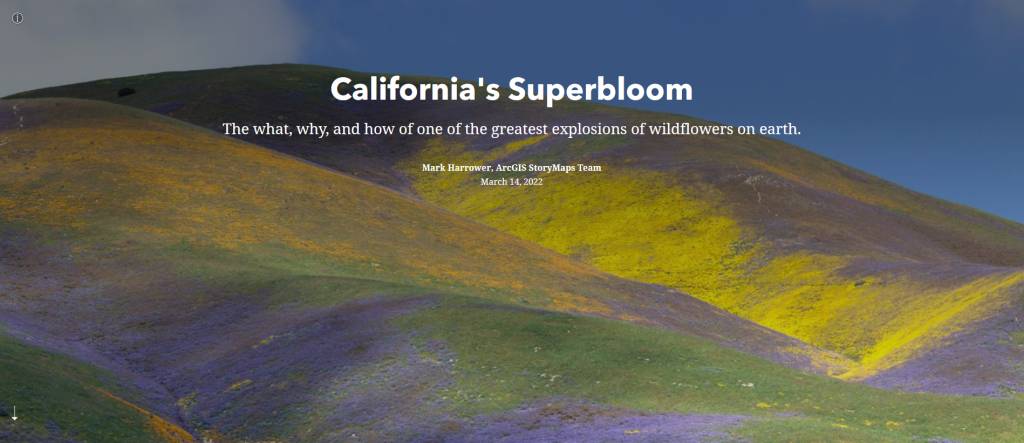
Header of the California's Superbloom StoryMap

Speaking of beautiful photos, this StoryMap about California’s Superbloom is full of them! It’s a great example of the StoryMap image gallery and “swipe” tools. The StoryMap swipe tool allows you to juxtapose different maps or images, revealing the difference between, for example, historical and modern photos, or satellite imagery during different times of year in the same region.

The Surprising State of Africa’s Giraffes

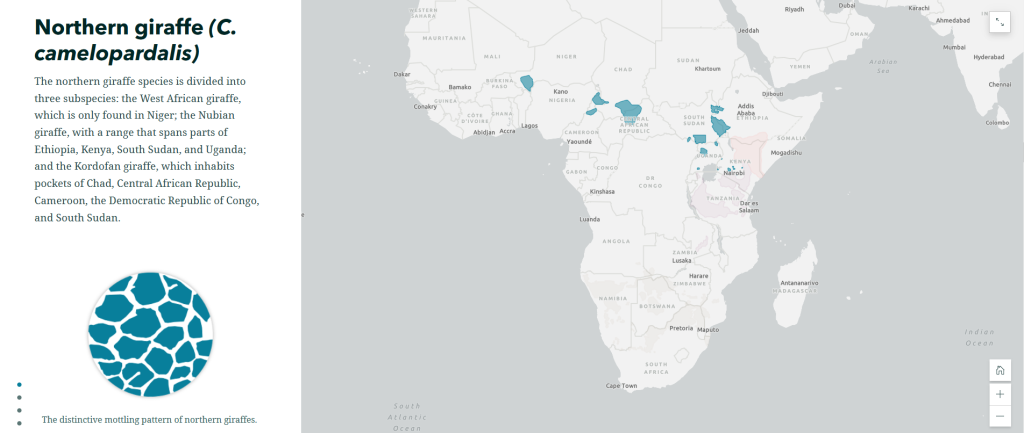
Screenshot of The Surprising State of Africa’s Giraffes StoryMap with a map highlighting the habitat of the Northern Giraffe

The Surprising State of Africa’s Giraffes is a StoryMap created by ESRI’s StoryMaps team that demonstrates another great use for the sidecar. As users scroll through the sidecar pictured above, different regions of the map are highlighted in an almost animated effect. This not only provides geographic context to the information, but does so in a dynamic way. This StoryMap also includes a great example of an express map, which is an easy way to make an interactive map without any GIS experience or complicated software.

Map Tour Examples

StoryMaps also features a tool that allows you to take users on a tour around the world – or just around your hometown. The map tour comes in two forms: a guided tour, like the one exemplified in Crowded Skies, Expanding Airports; and an explorer tour, such as The Things that Stay with Us.

StoryMaps Gallery

There are so many different forms a StoryMap can take! To see even more possibilities, check out the StoryMaps Gallery to explore nearly a hundred different examples. If you’re ready to get your feet wet but want a bit more support, keep an eye on the Savvy Researcher calendar for upcoming StoryMap workshops at the UIUC Main Library.