Learn Data Analysis Over the Winter Break!

In the last twenty years, humanity has become super proficient in collecting data. Therefore, It is no surprise that the skills to analyze that massive collection of data is in ever increasing demand on the job market. For those of us who are worried about future job prospects, learning these in-demand data analysis skills seems like a logical next step, even if they do not fit into our current degree program. Fortunately, the university has a plethora of self-guided resources available for students looking to build their data skills. What better time to use these resources than during the long winter break?! Over the next few weeks, this blog will delve into the available resources that cover the three main skill areas of data analysis: math, coding and software, and visualization. 

Before diving into those areas, it is wise briefly look at the foundations of data analysis as well as the resources that will be showcased this month. Take this week to get acquainted with these different resource platforms and learn a few starting skills! 

LinkedIn Learning

All UIUC students have access to LinkedIn Learning. Simply login with your NetID credentials, just be sure you are logging into LinkedIn Learning, not the main LinkedIn site.  You will have access to a whole trove of high-quality videos and courses designed to help you learn career-building skills. Not only are the videos professional grade, but they often have accompanying exercise files, learning groups, certificates and exams. The collection ranging from short 5-15 minute videos that teach specific function or skills to dozen hours long courses that are designed to give a comprehensive foundation. The best part of using LinkedIn Learning is that the course and certificates completed here are then displayed on personal LinkedIn pages, showing potential employers that users have the skills they are looking for. 

  • Data Analytics for Students
    • This course is for the true data analytics babies out there. This introduction gives users the basic understanding of what data analytics is, the skills users will need to be successful,  the software and tools common in the field and what careers in data analytics look like. This 1 hour course is well worth the time for those who aren’t sure where to start their data journey.
  • Career Essentials in Data Analysis by Microsoft and LinkedIn
    • Discover the skills needed for a career in data analysis. Learn foundational concepts used in data analysis and practice using software tools for data analytics and data visualization. This is a Learning Path made up of 3 different courses that has about 9 hours of content for students to work through on their own schedule. The courses have exams for self-evaluation as well as a final exam that earns users a professional certificate. 
  • Excel: Managing and Analyzing Data
    • We have all put “proficient in Excel” on a resume, but wouldn’t it be nice if that was actually true? Unlike other data analytics courses, this course focuses on one program that most modern users are already familiar with but do not truly harness the power of. This is ideal for baby data analysts as it doesn’t bombard learners with a whole new software ecosystem but still teaches the transferable skills all data analysts use. Running at just under 4 hours, this course efficiently and comprehensively teaches users impressive data analytics skills. 

O’Reilly Books and Videos

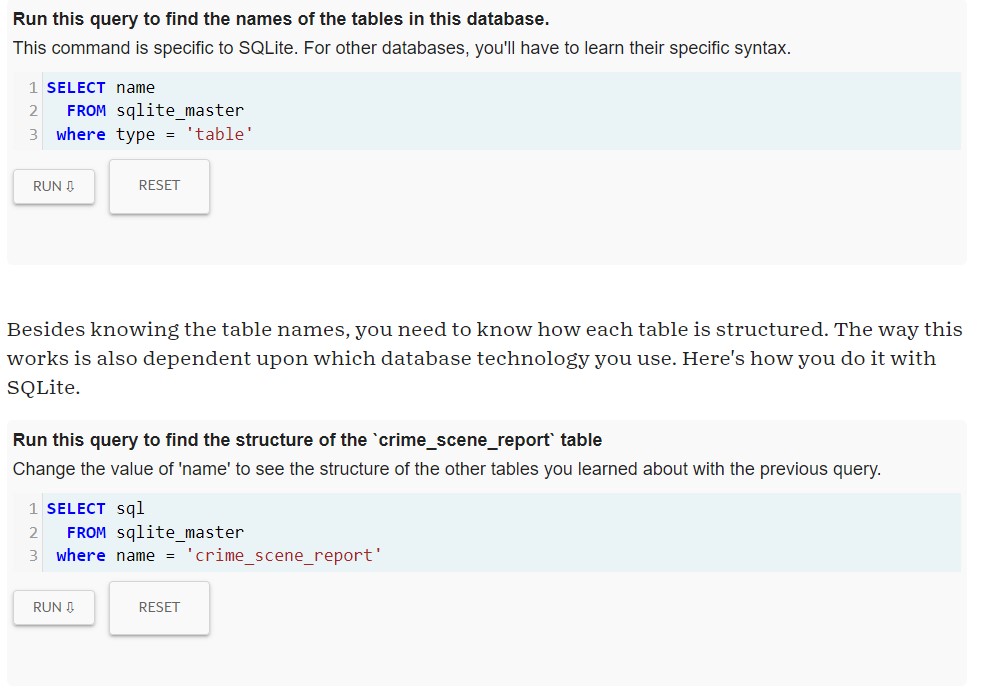
This is a lesser known resource available at UIUC but it has some great online books and videos that tend to focus on the scientific and technical fields. Logging in is not straightforward, unfortunately. The best way to get there is to go to the Library Catalog’s record for a book offered through O’Reilly (Like this book on Python) and then follow the instructions on this LibGuide to log in. Once you are in, you will see a sizable collection of e-books and courses. The materials skew towards the more experienced users, but there are a few resources that will help baby data folks really develop their skills. 

Library Catalog

Learn data science the old fashion way, with books! There are a lot of books available at UIUC libraries for students who want to teach themselves a new skill. Here are a few choices for people looking for an easy introduction to data analysis. The Scholarly Commons collection is easily accessible and found just to the right of the main entrance to the stacks. 

Be sure to check back here next week for our next installment, “What’s Math got to do with it?”!

Making Infographics in Canva: a Guide and Review

Introduction

If you’ve ever had to design a poster for class, you’re probably familiar with Canva. This online and app-based graphic design tool, with free and subscription-based versions, features a large selection of templates and stock graphics that make it pretty easy to create decent-looking infographics. While it is far from perfect, the ease of use makes Canva worth trying out if you want to add a bit of color and fun to your data presentation.

Getting Started

Starting with a blank document can be intimidating, especially for someone without any graphic design experience. Luckily, Canva has a bunch of templates to help you get started.

Canva infographic templates

I recommend picking a template based on the color scheme and general aesthetic. It’s unlikely you’ll find a template that looks exactly how you want, so you can think of a template as a selection of colors, fonts, and graphics to use in your design, rather than something to just copy and paste things into. For example, see the image below – I recently used the template on the left to create the infographic on the right.

An infographic template compared to the resulting infographic

General Design Principles

Before you get started on your infographic, it’s important to remember some general design guidelines:

  1. Contrast. High levels of contrast between your background and foreground help keep everything legible.
  2. Simplicity. Too many different colors and fonts can be an eyesore. Stick to no more than two fonts at a time.
  3. Space. Leave whitespace to keep things from looking cluttered.
  4. Alignment and balance. People generally enjoy looking at things that are lined up neatly and don’t have too much visual weight on one side or another.
An exaggerated example of a design that ignores the above advice.

Adding Graphs and Graphics

Now that you have a template in hand and graphic design principles in mind, you can start actually creating your infographic. Under “Elements,” Canva includes several types of basic charts. Once you’ve added a chart to your graphic, you can edit the data associated with the chart directly in the provided spreadsheet, by uploading a csv file, or by linking to a google spreadsheet.

Canva interface for creating charts

The settings tab allows you to decide whether you want the chart to include a legend or labels. The options bar at the top allows for further customization of colors and bar or dot appearance. Finally, adding a few simple graphics from Canva’s library such as shapes and icons can make your infographic more interesting. 

Examples of charts available in Canva, with a variety of customizations.

Limitations and Frustrations

The main downsides to Canva are the number of features locked behind a paywall and the inability to see only the free options. Elements cannot be filtered by price and it seems that more and more graphics are being claimed by Canva Pro, so searching for graphics can be frustrating. Templates can be filtered, but it will still bring up results where the template itself is free, but there are paid elements within the template. So, you might choose a template based on a graphic that you really like, only to find out that you need a Canva Pro subscription to include that graphic.

The charts in Canva also have limitations. Pie charts do not allow for the selection of colors for each individual slice; you have to pick one color, and Canva will generate the rest. However, if you want to have more control over your charts, or wish to include more complicated data representations, you can upload charts to Canva, which even supports transparency.

Conclusion

As mentioned above, Canva has its downsides. However, Canva’s templates, graphics, and charts still make it a super useful tool for creating infographics that are visually appealing. Try it out the next time you need to present some data!

Drawing People: Practicing the Human Figure with Open Resources

It’s Open Access Week! Every year this international event brings the academic community together to discuss the benefits of free and immediate access to information, especially scholarly resources.

This week, I’ll be sharing open (and semi-open) resources for artists. When I’m not at the library desk, I like to draw, and I’m always on the hunt for high quality reference images. When learning how to draw people, you’ll often have to figure out a pose without the help of live models. References, however, are not always free or easy to find. Here some of the resources that I’ve found helpful over the years.

Practice and Reference

Line of Action

Provides both nude and clothed photos for study. Artists can start a drawing session by choosing the kinds of models, and the time intervals between photos. There are also posts here that give advice for improving your technique.

Bodies in Motion

This collection of motion images provides rapid sequence photographs of athletes and dancers. These images are a good way to study how the human body moves. Most of this content is only available with a subscription, but there are some free sequences. When browsing a section, click the “free” tab on the right-hand side of the page.

AdorkaStock

This stock photo collection has models with plenty of different body types. There are some fun poses in here: from fantasy to action, to sci-fi settings. All models are wearing clothing or flesh-tone bodysuits, so no need to worry about using it in a public space.

Sketch Daily

Provides a variety of photos in timed study sessions. You can choose to practice bodies, hands, feet, heads, or animals and structures. It’s a good tool for warm-up drawing with no fuss.

The Book of a Hundred Hands by George B. Bridgman

This book depicts musculature and examples of drawn hands in different positions. It can help you to focus-in on your hand drawing skills.

Figure Drawing for All It’s Worth by Andrew Loomis

Okay, so this one is from the 40’s and it shows; the majority of nude female figures are still sporting high heels. However, Loomis still offers many helpful tips. It contains an exhaustive instruction of perspective, musculature, the mechanics of motion, shading and lighting as well as exercises for practice.

Gesture Drawing

Gesture Drawing – The Ultimate Guide for Beginners

Practicing with the gesture technique can help you break out of “stiff” poses and figure out how to imbue your figures with character and expression. This guide contains an overview of gesture, videos of instruction, and a list of books on gesture.

Clothing

We Wear Culture

A good fashion reference site that showcases clothing through time and around the world. The information here gives context for clothing, bios of fashion icons, overviews of fashion movements, and the history of clothing items. It’s a good tool to inspire clothing design for the people and characters you draw.

History of Costume

You’ll have to create a free account on the Internet Archive to view this one. It’s a collection of costume plates from the 19th century. There are later editions of this book available, but this edition still contains original clothing pattern drafts.

Instruction

Love, Life, Drawing

This website provides free tutorials and podcasts on drawing topics with a focus on human figures. Sign up for the free “fresh eyes” drawing challenge, a ten-day course that teaches students to identify gesture and structure of the form.

FZD School

This resource isn’t human-figure specific but these videos are great resources for learning how to draw and design. Try “EP 30: Character Silhouettes” to buff up your character illustration skills. This channel is especially good for creatives interested in comics or illustration.

Muddy Colors

Muddy Colors posts helpful tips on all kinds of art topics from over 20 practicing artists. The site hosts paid classes from their contributing artists, but there is plenty of free advice here too.

Additional Resources

Character Design References

An independent website that showcases concept art from animation, games, and comics. There’s a little bit of everything here. I’d recommend checking out their visual library. There are anatomical references, character/creature design references, vehicles, props, and lighting/color tutorials.

Met Publications

The New York Met Gallery offers 609 publications of art, photography, sculpture and more, all free for download. This is an excellent place to find inspiration.

Happy Drawing!

There’s been a Murder in SQL City!

by Libby Cave
Detective faces board with files, a map and pictures connected with red string.

If you are interested in data or relational databases, then you have heard of SQL. SQL, or Structured Query Language, is designed to handle structured data in order to assist in data query, data manipulation, data definition and data access control. It is a very user-friendly language to learn with a simple code structure and minimal use of special characters. Because of this, SQL is the industry standard for database management, and this is reflected in the job market as there is a strong demand for employees with SQL skills.  

Enter SQL Murder Mystery

In an effort to promote the learning of this valuable language, Knight Labs, a specialized subsidiary of Northwestern University, created SQL Murder Mystery. Combining the known benefits of gamification and the popularity of whodunit detective work, SQL Murder Mystery aims to help SQL beginners become familiar with the language and have some fun with a normally dry subject. Players take on the role of a gumshoe detective tasked with solving a murder. The problem is you have misplaced the crime scene report and you now must dive into the police department’s database to find the clues. For true beginners with no experience, the website provides a walkthrough to help get players started. More experienced learners can jump right in and practice their skills. 

I’m on the case!

I have no experience with SQL but I am interested in database design and information retrieval, so I knew it was high time that I learn the basics. As a fan of both games and detective stories, SQL Murder Mystery seemed like a great place to start. Since I am a true beginner, I started with the walkthrough. As promised on the website, this walkthrough did not give me a complete, exhaustive introduction to SQL as a language, but instead gave me the tools needed to get started on the case. SQL as a language, relational databases and Entity Relationship Diagrams (ERD) were briefly explained in an approachable manner. In the walk through, I was introduced to vital SQL functions like “Select:, “Where”, wildcards, and “Between”. My one issue with the game was in the joining tables section. I learned later that the reason I was having issues was due to the tables each having columns with the same title, which is apparently a foundational SQL feature. The guide did not explain that this could be an issue and I had to do some digging on my own to find out how to fix it. It seems like the walkthrough should have anticipated this issue and mentioned it. That aside, By the end of the walkthrough, I could join tables, search for partial information matches, and search within ranges. With some common sense, the database’s ERD, and the new SQL coding skills, I was able to solve the crime! If users weren’t challenged enough with that task, there is an additional challenge that suggests users find the accomplice while only using 2 queries.

User interface of SQL Murder Mystery
Example of SQL Murder Mystery user interface

The Verdict is In

I really loved this game! It served as a great introduction to a language I had never used before but still managed to be really engaging. It reminded me of those escape room mystery boxes like Hunt a Killer that has users solve puzzles to get to a larger final solution. Anyone who loves logic puzzles or mysteries will enjoy this game, even if they have no experience with or even interest in coding or databases.  If you have some free time and a desire to explore a new skill, you should absolutely give SQL Murder Mystery a try!

A Different Kind of Data Cleaning: Making Your Data Visualizations Accessible

Introduction: Why Does Accessibility Matter?

Data visualizations are a fast and effective manner for communicating information and are increasingly becoming a more popular way for researchers to share their data with a broad audience. Because of this rising importance, it is also necessary to ensure that data visualizations are accessible to everyone. Accessible data visualizations not only help an audience who may require a screen reader or other accessible tool to read a document but are also helpful to the creators of the data visualization as it brings their data to a much wider audience than through a non-accessible data visualization. This post will offer three tips on how you can make your visualization accessible!

TIP #1: Color Selection

One of the most important choices when making a data visualization are the colors used in the chart. One suggestion would be to use a color blindness simulator to check the colors in the data visualization and experiment to find the right amount of contrast between colors. Look at the example regarding the top ice cream flavors:

A data visualization about the top flavors of ice cream. Chocolate was the top flavor (40%) followed by Vanilla (30%), Strawberry (20%), and Other (10%).

At first glance, these colors may seem acceptable to use for this kind of data. But when ran through the colorblindness simulator, one of the results creates an accessibility concern:

This is the same pie chart above, but placed under a tritanopia color blindness lens. The colors used for strawberry and vanilla now look the exact same and blend into one another because of this, making it harder to discern the amount of space they take in the pie chart.

Although the colors contrasted well enough in the normal view, the color palettes used for the strawberry and vanilla categories look the same for those with tritanopia color blindness. The result is that these sections blend into one another and make it more difficult to distinguish their values. Most color palettes incorporated in current data visualization software are already designed to ensure the colors do not contrast, but it is still a good practice to check to ensure the colors do not blend in with one another!

TIP #2: Adding Alt Text

Since most data visualizations often appear as images in either published work or reports, alt text is a crucial need for accessibility purposes. Take the visualization below. If there was no alt text provided, then the visualization is meaningless to those who rely on alt text to read a given document. Alt text should be short and summarize the key takeaways from the data (there is no need to describe each individual point, but it should provide enough information to describe the trends occurring in the data).

This is a chart showing the population size of each town in a given county. Towns are labeled A-E and continue to grow in population size as they go down the alphabet (town A has 1,000 people while town E has 100,000 people).

TIP #3: Clearly Labeling Your Data

A simple but crucial component of any visualization is having clear labels on your data. Let’s look at two examples to see what makes having labels a vital aspect of any data visualization:

This is a chart for how much money was earned/spent at a lemonade stand by month. There is no y-axis labels to describe how much money is earned/spent and no key to discern the two lines that represent the money made and the money spent.

There is nothing in this graph that provides any useful information regarding the money earned or spent at the lemonade stand. How much money was earned or spent each month? What do these two lines represent? Now, look at a more clearly labeled version of the same data:

This is a cleaned version of the previous visualization regarding how much money was earned/spent at a lemonade stand. The addition of a Y-axis and key now show that more money was spent in January/February than earned, but then changes in March peaking in July, and then continuing to fall until December where more money is spent than earned again.

In adding a labeled Y-axis, we can now quantify the difference in distance between the two lines at any point and have a better idea of the money earned/spent in any given month. Furthermore, the addition of a key at the bottom of the visualization distinguishes the lines telling the audience what each represents. By clearly labeling the data, it is now in a position where audience members can interpret and analyze it properly.

Conclusion: Can My Data Still be Visually Appealing?

While it may appear that some of these recommendations detract from the creative designs of data visualizations, this is not the case at all. Designing a visually appealing data visualization is another crucial aspect of data visualization and should be heavily considered when creating one. Accessibility concerns, however, should have priority over the visual appeal of the data visualization. That said, accessibility in many respects encourages creativity in the design, as it makes the creator carefully consider how they want to present their data in a way that is both accessible and visually appealing. Thus, accessibility makes for a more creative and transmissive data visualization and will benefit everyone!