Designing a Research Poster

Posters are widely used in the academic community, and most conferences include poster presentations in their program.  Research posters summarize information or research concisely and attractively to help publicize it and generate discussion. As we prepare for the Undergraduate Research Symposium, here are some tips to help you make an engaging poster.  

Essential Elements of a Poster 

The essential items that must be included in your poster are these five things:  

  • Title 
  • Names of Presenters/Researchers 
  • Contact Information 
  • Institutional Affiliation 
  • Your Research  

The first four elements of that are reasonably straightforward. The fifth element (your research) is a little less direct, but it leaves you space to be creative with your poster design so that it matches what you have to say about your research.  

What Makes a Good Research Poster 

The poster format provides more freedom in how to present an idea than a standard academic paper, so feel free to be creative in your poster design. Don’t feel limited by the text of the paper that you’re basing the poster on or strict conventions of how all posters “should” look. You can use boxes, different formatting techniques, fonts, and images to create a visually pleasing poster. Generally, you want to follow these basic design guidelines:  

  • Important information should be readable from about 10 feet away
  • Text is clear and to the point  
  • Use of bullets, numbering, and headlines make it easy to read  
  • Effective use of graphics, color and fonts  
  • Consistent and clean layout 
poster about tips for designin an effective research poster

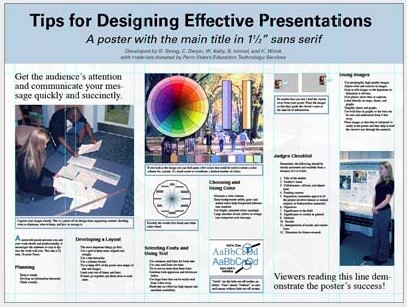
Image credit: Poster Session Tips by mousejockey@psu.edu, via Penn State


Different disciplines have different norms and expectations as to what should be included. If you’re unsure of what’s appropriate for your field, look for some examples of research posters in your discipline, or ask one of your professors for guidance. 

What Software Can I Use to Make a Poster 

You have many options to create a research poster. Three common tools are:  

  • PowerPoint 
  • Adobe InDesign 
  • Canva 

Most people feel most comfortable using PowerPoint, especially since it can be pretty straightforward to use if you have used Microsoft Office Products before.  

Adobe InDesign will give you complete creative flexibility, but it can be difficult to use if you have never used an Adobe product before. You can get a free Adobe license during the 2021-2022 school year through the Illinois WebStore 

Canva is great for creating professional looking design with a user-friendly, simple approach. However, it has a fairly narrow window of poster sizes that can be used with the free version, so you can check that out before starting your design. Even if you are unable to create your poster on Canva due to size restriction, it is a good place to get some inspiration and then carry those ideas over to PowerPoint or InDesign.  

Whichever software you use to create your poster, make sure to double check that your poster meets the size requirements. The standard size for a research poster is 48” by 36″, but make sure to verify with your advisors before sending it off to print. 

Visualizations 

Including visualizations can help your poster stand out and help others understand your research. There are lots of ways to include visualizations on your poster, including:  

  • Graphs 
  • Charts  
  • Photographs 
  • Word Clouds 
  • Quotations  
  • Stock Images 
word cloud visualization of presentation tags

Image credit: Visualizations by Scholarly Commons via University of Illinois

If you plan to use stock images in your poster or have copyright questions about legally using images, contact the library and we can help!  

The staff at the Scholarly Commons also has knowledge about resources that can help you create data visualizations, such as Excel, Tableau, Wordle, ArcGIS, and more.  

Printing Tips 

Knowing how and when to print your poster can be tricky. Follow these guidelines to make sure your poster is printed correctly and on time:  

  • Printing out posters takes time, especially around the Undergraduate Research Conference. Be sure to finish your poster with enough time for it to be printed!      
  • Print yourself a small version of your poster to make sure the proportions and colors look correct. Some print services offer these pre-prints 
  • Have a friend look your poster over for spelling or grammatical mistakes      
  • Be sure your file is the correct size before sending it off 
  • Do not laminate your poster or print them on poster board, print posters on fabric for easy travel or print on poster paper 

For more tips, examples, and how-to guides, feel free to check out the Scholarly Commons Research Posters LibGuide 

Meet Our Graduate Assistants: Ryan Yoakum

In this interview series, we ask our graduate assistants questions for our readers to get to know them better. Our first interview this year is with Ryan Yoakum!

This is a headshot of Ryan Yoakum.

What is your background education and work experience?

I came to graduate school directly after receiving my bachelor’s degree in May 2021 in History and Religion here at the University of Illinois. During my undergraduate, I had taken a role working for the University of Illinois Residence Hall Libraries (which was super convenient as I lived in the same building I worked in!) and absolutely loved helping patrons find resources they were interested in. I eventually took a second position with them as a processing assistant, which gave me a taste for working on the back end as I primarily prepared materials bought to be shelved at each of the libraries within the system. I really loved my work with the Residence Hall Libraries and wanted to shift my career to working in a library of some form, which has led me here today!

What are your favorite projects you’ve worked on?

I have really enjoyed projects where I have gotten to work with data (both for patrons as well as internal data). Such projects have allowed me to explore my growing interest in data science (which is the last thing I would have initially expected when I began the master’s program in August 2021). I have also really enjoyed teaching some of the Savvy Researcher workshops, which have included ones on optical character recognition (OCR) and creative commons licensing!

What are some of your favorite underutilized Scholarly Commons resources that you would
recommend?

The two that come to mind are the software on our lab computers as well as our consultation services. If I were still in history, using ABBYY FineReader for OCR would have been a tremendous help as well as supplementing that with qualitative data analysis tools such as ATLAS.ti. I also appreciate the expertise of the many talented people who work here in the library. Carissa Phillips and Sandi Caldrone, for example, have been very influential in helping me explore my interests in data. Likewise, Wenjie Wang, JP Goguen, and Jess Hagman (all of whom now have drop-in consultation hours) have all guided me in working with software related to their specific interests, and I have benefitted greatly by bringing my questions to each of them.

When you graduate, what would your ideal job position look like?

I currently have two competing job interests in mind. The first is that I would love to work in a theological library. The theological library could be either in a seminary or an academic library focusing on religious studies. Pursuing the MSLIS has also shifted my interests in working with data, so I would also love to work a job where I can manage, analyze, and visualize data!

What is the one thing you would want people to know about your field?

Library and Information science is not a field limited to working in the stereotypical way society pictures what a librarian’s work looks like (there was a good satirical article recently on this). It is also far from being a dead field (and one that will likely gain more relevance over time). As part of the program, I am slowly gaining skills that have prepared me for working in data which can apply in any field. There are so many job opportunities for MSLIS students that I strongly encourage people to join the field if they are interested in library and information science but have doubts about its career prospects!

Open Education Week 2022

Open Education Week

Open Education Week brings awareness to the Open Educational Resources (OER) movement and to the how OER transforms teaching and learning for instructors and students alike.

What is OER?

OER refers to open access, openly licensed instructional materials that are used for teaching, learning or research.

Why is OER Important?

OER provides free resources to institutions, teachers, and students. When incorporated into the classroom, OER can:

  • Lower the cost of education for students
  • Reinforce open pedagogy
    • Allow educators to update and adapt materials to fit their needs
    • Encourages students’ interaction with, and creation of, educational materials
  • Encourage open knowledge dissemination

OER Incentive Grant

The University is giving faculty an incentive to adopt, adapt, or create OER for their courses instead of using expensive materials. The OER Incentive Grants will fund faculty teaching undergraduate courses. Instructors can submit applications in three tiers:

  • Tier 1: Adopt – incorporate an existing open textbook into a course
  • Tier 2 Adapt – incorporate portions of multiple existing open textbooks, along with other freely available educational resources, modifications of existing open education materials/textbooks, or development of new open education materials
  • Tier 3: Create – write new openly licensed textbooks

The preferred deadline to submit a proposal is March 11th. If you are interested in submitting a grant but cannot make this deadline, please reach out to Sara Benson at srbenson@illinois.edu. To learn more about this program see the webpage on the Faculty OER Incentive Program.

Upcoming OER Publication

In conjunction with Sara Benson, copyright librarian at UIUC, and the Illinois Open Publishing Network (IOPN), co-authors Christy Bazan, Brandi Barnes, Ryan Santens, and Emily Verone will publish an OER textbook, titled Drug Use and Misuse: A Community Health Perspective. This book explores drug use and abuse through the lens of community health and the impact of drug use and abuse on community health. Drug Use and Misuse is the third publication in IOPN’s Windsor & Downs Press OPN Textbook series. See the video below to learn more about the process of creating this textbook.

Going Down the Jane Austen Rabbit Hole

This post is part of a series for Love Data Week, which takes place February 14-18 2022.

Written by Heidi Imker, Director of the Library Research Data Service

When you think of data, your mind probably doesn’t jump right to Pride and Prejudice. That is, unless you’re Heidi Imker, Director of the Research Data Service and amateur Jane Austen internet sleuth. “In late 2020,” Heidi says, “I was in desperate need of a post-Outlander spiritual cleanse. Naturally, I turned to Pride and Prejudice. Over a year later, I’m still in the midst of a fantastic, out-of-control Jane Austin binge, and I’ve got oodles of related resources worthy of Love Data Week.”

Join Heidi on a virtual tour of some of her favorite data resources about Austen, her works, and historical England.

  1. janeaustenr: Jane Austen’s Complete Novels

In this fabulous R package, data scientist Julia Silge used text data for the Austen novels available from the also fabulous Project Gutenberg. The package offers cleaned data, documentation, and scripts to play with and analyze the novels.

  1. Word Frequencies in English-Language Literature, 1700-1922

Randomly, sifting through the janeaustenr dataset gave me a new level of appreciation for the word “ignore.” Austen didn’t use “ignore” once in any of her novels. It turns out that no one was really using it because it hadn’t caught on yet. In fact, according to Google’s ngram viewer, “ignore” didn’t start getting traction until circa 1845. And now you might be thinking word frequency data is fun, and it is! Like this word frequencies dataset available from the HathiTrust Research Center.

  1. Napoleon Series

One of the things I learned during this binge was that dating the events in Pride and Prejudice has been a subject of debate for some time (as in, about a century). I found it downright fascinating that scholars could map parts of the book to the 1811 calendar year and others to the year 1794. I had never really thought about the characters existing in a specific year, but now I wondered what else was happening in those years? I discovered the Waterloo Association, a community of military historians behind the Napoleon Series. This immense archive contains articles on military history, biographies, and documentation of thousands of officers and soldiers (such as Challis’s Peninsula Roll Call).

  1. London Lives

Provides searchable access to >240,000 digitized pages of archival documents, with special focus on crime, poverty, and social policy. Not only is the source material available, but the people behind London Lives have made it a point to keep humanity at the forefront by constructing biographies of the individuals caught in the crime and poverty cycle in London between 1690 and 1800.

  1. Calendar of London Concerts 1750-1800

My favorite dataset of all time, it was thoughtfully and painstakingly created by Professor Simon McVeigh at Goldsmiths, University of London over many decades. It lists 4,001 concert events, as found through locating and documenting adverts in archival newspapers—by hand. When Lady Catharine tells Elizabeth that “it will be in my power to take one of you as far as London, for I am going there early in June, for a week,” what could that self-professed music aficionado have heard in June 1794? Voila! Perhaps it was Handel’s Messiah at St Margaret’s Church in Westminster on Thursday, June 5th.

I appreciate the Calendar of London Concerts dataset for my odd little hobby, but I love it as an information professional. The sheer dedication it took assemble the data, especially with such strict attention to detail, is incredible. Let me explicitly gush about the documentation for a moment. Context! References! Abbreviations! All explained! What’s “HM”? His Majesty’s something or other? No, it’s the Half-Moon Tavern in Cheapside. Currency conversions! Syntax for nearly impossible to standardize programme content! It’s forty-four glorious pages! Swoon!

Related resources on London concerts

What started out as a casual, online-friendly hobby ended up introducing me to a wealth of enlightening open data resources, and I’m in love with every one of them. Since my Austen binge is apparently nowhere near over, you may well get another link-laden post for next year’s Love Data Week. <3

Headshot of HeidiHeidi Imker is the Director of the Research Data Service (RDS) and an Associate Professor at the University of Illinois at Urbana-Champaign. The RDS helps researchers across the Urbana-Champaign campus manage and share research data, and in her role as Director, she ensures the RDS takes a collaborative, user-oriented, and practical approach to research support. Heidi holds a Ph.D. in Biochemistry from the University of Illinois and did her postdoctoral research at the Harvard Medical School.

OpenRefine: a Cinderella Story but for Data

This post is part of a series for Love Data Week, which takes place February 14-18 2022.

Written by Dena Strong

Ever wish you could call on a fairy godmother who could wave a magic wand and make all your data problems disappear? Luckily for us at the University of Illinois, we can call on Senior Information Design Specialist Dena Strong. Dena can solve data problems so fast it seems downright magical. For Love Data Week 2022, check out Dena’s story about OpenRefine, the data tool she loves beyond all reason:

“I once had a consultation with a person who presented me with two Excel files and a data cleaning dilemma that he estimated was going to take him 200 hours of manual labor to repair. It took me 15 minutes of conversation to understand what he needed to do with the files to get them clean and integrated – and then it took me 5 minutes in OpenRefine to do the data cleaning and teach him how to do the same so he could do it again whenever he wanted. The other 199.6 hours of his time went to more productive uses. He and I have both been OpenRefine cheerleaders ever since. When I did a Caffeine Break session about it, an attendee said it was the most useful 45 minutes of training he’d ever had.”

As of the time of this writing, none of Dena’s datasets have turned back into pumpkins.

Headshot of DenaDena Strong (MLIS) is a member of the Web Hosting team at Technology Services; she also serves as a liaison with the Research Data Service at the Library. With 20 years of experience in usability, accessibility, information architecture, and workflows, Dena enjoys collaborating and consulting with people across campus. She’s also been spotted studying six languages, reproducing Heian-era Japanese dye techniques, and occasionally burning Kool-aid in search of new fabric colors.