Going Down the Jane Austen Rabbit Hole

This post is part of a series for Love Data Week, which takes place February 14-18 2022.

Written by Heidi Imker, Director of the Library Research Data Service

When you think of data, your mind probably doesn’t jump right to Pride and Prejudice. That is, unless you’re Heidi Imker, Director of the Research Data Service and amateur Jane Austen internet sleuth. “In late 2020,” Heidi says, “I was in desperate need of a post-Outlander spiritual cleanse. Naturally, I turned to Pride and Prejudice. Over a year later, I’m still in the midst of a fantastic, out-of-control Jane Austin binge, and I’ve got oodles of related resources worthy of Love Data Week.”

Join Heidi on a virtual tour of some of her favorite data resources about Austen, her works, and historical England.

  1. janeaustenr: Jane Austen’s Complete Novels

In this fabulous R package, data scientist Julia Silge used text data for the Austen novels available from the also fabulous Project Gutenberg. The package offers cleaned data, documentation, and scripts to play with and analyze the novels.

  1. Word Frequencies in English-Language Literature, 1700-1922

Randomly, sifting through the janeaustenr dataset gave me a new level of appreciation for the word “ignore.” Austen didn’t use “ignore” once in any of her novels. It turns out that no one was really using it because it hadn’t caught on yet. In fact, according to Google’s ngram viewer, “ignore” didn’t start getting traction until circa 1845. And now you might be thinking word frequency data is fun, and it is! Like this word frequencies dataset available from the HathiTrust Research Center.

  1. Napoleon Series

One of the things I learned during this binge was that dating the events in Pride and Prejudice has been a subject of debate for some time (as in, about a century). I found it downright fascinating that scholars could map parts of the book to the 1811 calendar year and others to the year 1794. I had never really thought about the characters existing in a specific year, but now I wondered what else was happening in those years? I discovered the Waterloo Association, a community of military historians behind the Napoleon Series. This immense archive contains articles on military history, biographies, and documentation of thousands of officers and soldiers (such as Challis’s Peninsula Roll Call).

  1. London Lives

Provides searchable access to >240,000 digitized pages of archival documents, with special focus on crime, poverty, and social policy. Not only is the source material available, but the people behind London Lives have made it a point to keep humanity at the forefront by constructing biographies of the individuals caught in the crime and poverty cycle in London between 1690 and 1800.

  1. Calendar of London Concerts 1750-1800

My favorite dataset of all time, it was thoughtfully and painstakingly created by Professor Simon McVeigh at Goldsmiths, University of London over many decades. It lists 4,001 concert events, as found through locating and documenting adverts in archival newspapers—by hand. When Lady Catharine tells Elizabeth that “it will be in my power to take one of you as far as London, for I am going there early in June, for a week,” what could that self-professed music aficionado have heard in June 1794? Voila! Perhaps it was Handel’s Messiah at St Margaret’s Church in Westminster on Thursday, June 5th.

I appreciate the Calendar of London Concerts dataset for my odd little hobby, but I love it as an information professional. The sheer dedication it took assemble the data, especially with such strict attention to detail, is incredible. Let me explicitly gush about the documentation for a moment. Context! References! Abbreviations! All explained! What’s “HM”? His Majesty’s something or other? No, it’s the Half-Moon Tavern in Cheapside. Currency conversions! Syntax for nearly impossible to standardize programme content! It’s forty-four glorious pages! Swoon!

Related resources on London concerts

What started out as a casual, online-friendly hobby ended up introducing me to a wealth of enlightening open data resources, and I’m in love with every one of them. Since my Austen binge is apparently nowhere near over, you may well get another link-laden post for next year’s Love Data Week. <3

Headshot of HeidiHeidi Imker is the Director of the Research Data Service (RDS) and an Associate Professor at the University of Illinois at Urbana-Champaign. The RDS helps researchers across the Urbana-Champaign campus manage and share research data, and in her role as Director, she ensures the RDS takes a collaborative, user-oriented, and practical approach to research support. Heidi holds a Ph.D. in Biochemistry from the University of Illinois and did her postdoctoral research at the Harvard Medical School.

OpenRefine: a Cinderella Story but for Data

This post is part of a series for Love Data Week, which takes place February 14-18 2022.

Written by Dena Strong

Ever wish you could call on a fairy godmother who could wave a magic wand and make all your data problems disappear? Luckily for us at the University of Illinois, we can call on Senior Information Design Specialist Dena Strong. Dena can solve data problems so fast it seems downright magical. For Love Data Week 2022, check out Dena’s story about OpenRefine, the data tool she loves beyond all reason:

“I once had a consultation with a person who presented me with two Excel files and a data cleaning dilemma that he estimated was going to take him 200 hours of manual labor to repair. It took me 15 minutes of conversation to understand what he needed to do with the files to get them clean and integrated – and then it took me 5 minutes in OpenRefine to do the data cleaning and teach him how to do the same so he could do it again whenever he wanted. The other 199.6 hours of his time went to more productive uses. He and I have both been OpenRefine cheerleaders ever since. When I did a Caffeine Break session about it, an attendee said it was the most useful 45 minutes of training he’d ever had.”

As of the time of this writing, none of Dena’s datasets have turned back into pumpkins.

Headshot of DenaDena Strong (MLIS) is a member of the Web Hosting team at Technology Services; she also serves as a liaison with the Research Data Service at the Library. With 20 years of experience in usability, accessibility, information architecture, and workflows, Dena enjoys collaborating and consulting with people across campus. She’s also been spotted studying six languages, reproducing Heian-era Japanese dye techniques, and occasionally burning Kool-aid in search of new fabric colors.

When did you first fall in love with data?

This post is part of a series for Love Data Week, which takes place February 14-18 2022.

Written by Lauren Phegley

Picture it – North Central College, Illinois, 2018. Twenty-one-year-old sociology major Laurent Phegley takes her seat in Professor Corsino’s class with no idea that she’s about to fall in love…with data. At the time, Dr. Corsino studied occupational attainment of Italian immigrants in Chicago Heights during the 1900’s. Lauren and her classmates sifted through census data to piece together the career tracks of (mostly male) Italian Americans. These data weren’t just checkmarks on a form. They were glimpses into entire families, glimpses that when pieced together told a story about how the American dream operates on the basis of social class. “For me, tracking the individuals through the census was a large puzzle,” Lauren says. Since then, Lauren has focused on helping other researchers solve their data puzzles. “Social science students are often not taught about data management because they don’t see their research as relating to ‘data’. I make a concerted effort now in my work and teaching to target fields that are often forgot about in terms of data management. Research is a labor of love. It is well worth a few hours of time to make sure that your data stays useable and understandable!”

Headshot of LaurenLauren Phegley is a graduate assistant for the Library Research Data Service pursuing her Masters of Science in Library and Information Science at the University of Illinois iSchool. Once she graduates in May 2022, she hopes to work as an academic librarian helping researchers manage their data and research.
Welcome to the new Scholarly Commons!

The staff at the Scholarly Commons are excited to welcome you to our new location in Room 220 of the Main Library! Over the course of the past year of remote work, we have been making progress on getting 220 ready for patron use by the start of the Fall semester and officially opened our new space on August 9th.

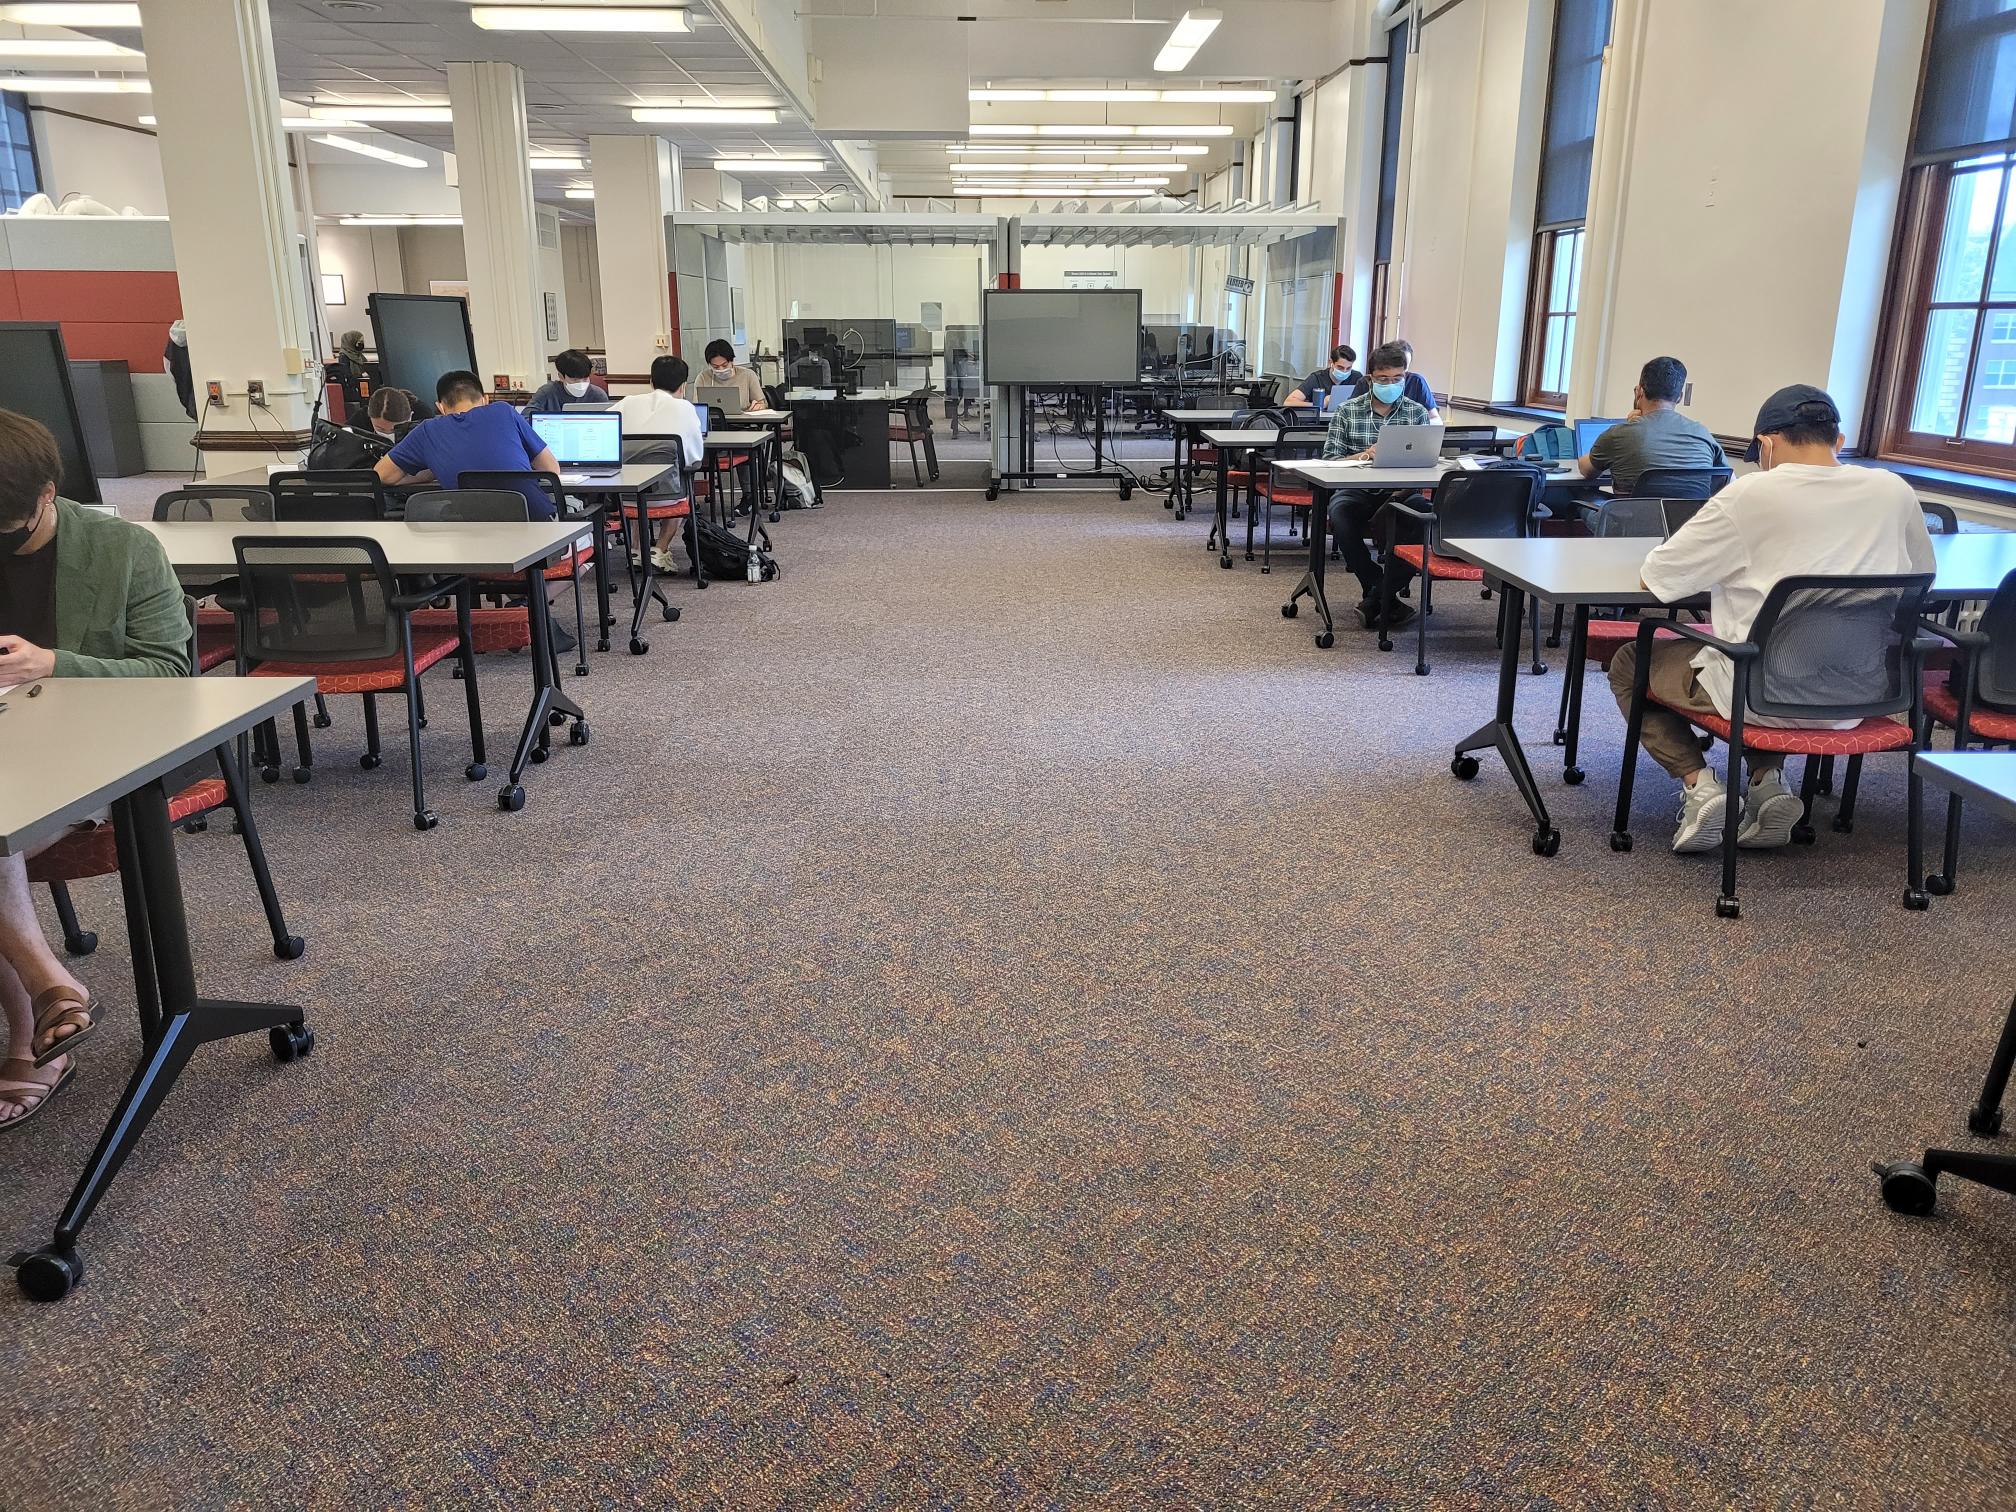
Study tables arranged in two rows with students studying.

Study tables located in Room 220

The new Scholarly Commons in Room 220 is a much bigger space that can accommodate more patrons, support individual and group study, host research consultations, and more. We have brand new soft furniture that patrons can lounge in, as well as several study tables that come with screen-casting monitors for easy collaboration.

Individual study pod with clear glass doors

Rooms available to reserve for individual or group study

Our patrons have also been excited about the group collaboration rooms, which are brand new to the Scholarly Commons. These rooms can be reserved for individual study or group meetings. They are glass-enclosed spaces with adjustable lighting, a monitor for screen-casting, and air conditioning. The pods can be reserved for two hours at a time through the library’s online reservation portal.

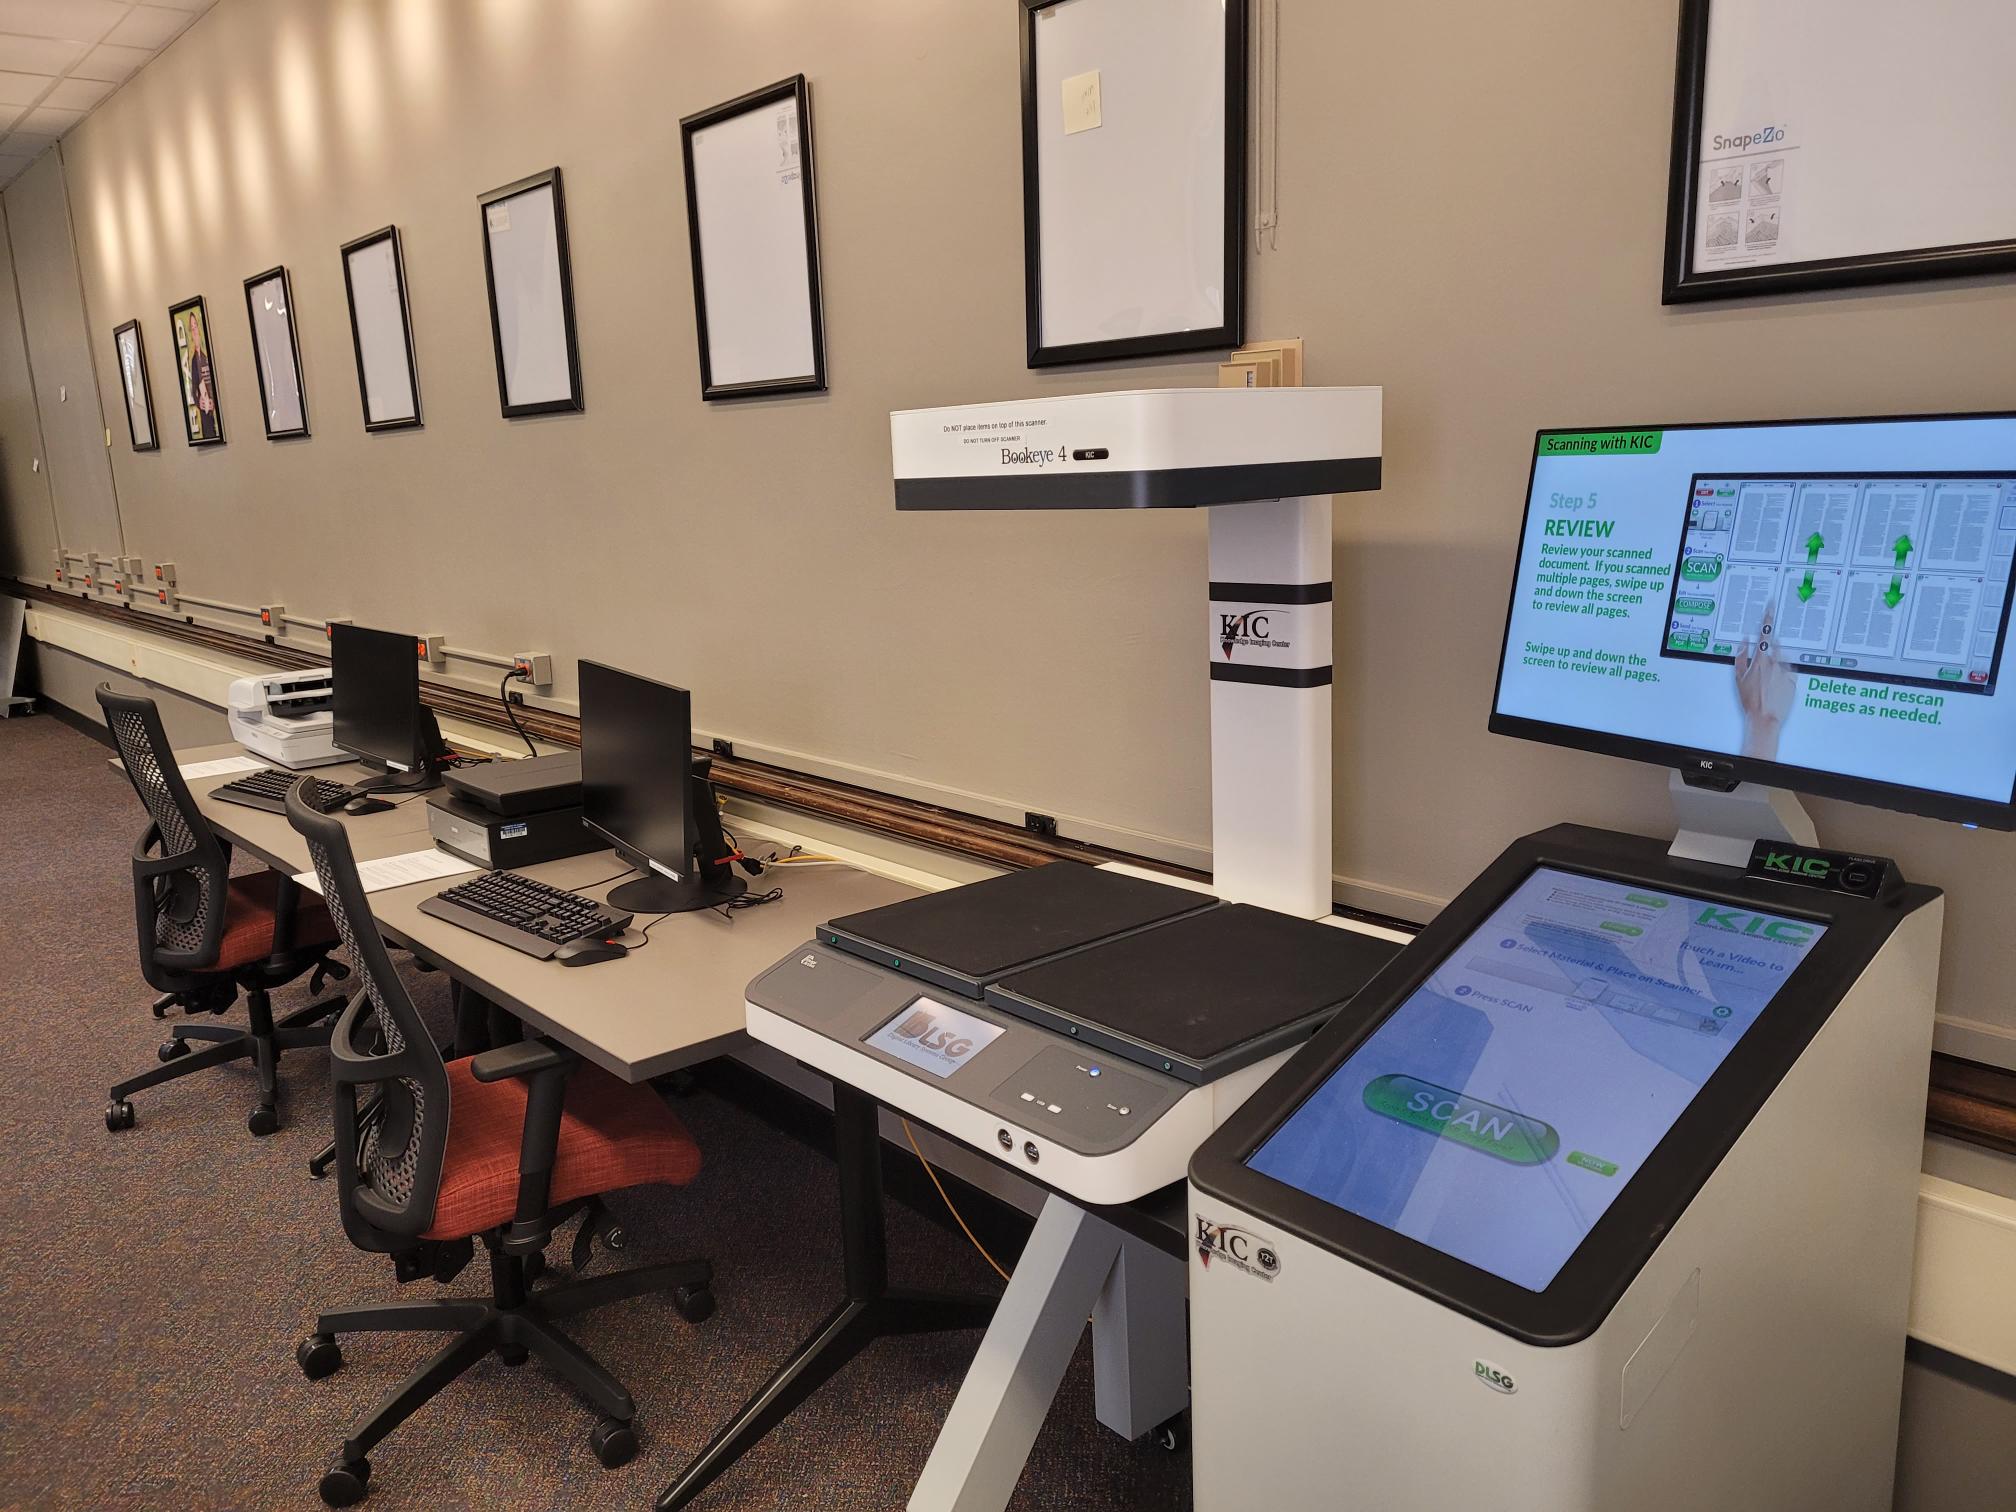
The Scholarly Commons mission of supporting the advanced research needs of the University of Illinois at Urbana-Champaign community continues in our new space, where we have 14 desktop computers equipped with specialized research software. A full list of software available in Room 220 is available on the Scholarly Commons website. You can also receive statistical consulting services through the Center for Innovation in Teaching and Learning in Room 220 during their drop-in hours. Our scanning equipment is also now located in Room 220, including our new KIC Bookeye Book Scanning Station.

Bookeye scanner with touchscreen and two flatbed scanners

Bookeye and Flatbed scanners

The Scholarly Commons service desk is also now located in Room 220 and is the best way to get immediate help from one of our staff members. We will also be available via our online chat and through email (sc@library.illinois.edu) during our oprerating hours, Monday-Thursday, 10am-4pm and Fridays 10am-noon. You can also visit Room 220 outside of these hours – the room will be available for use whenever the Main Library building is open.

We are so excited to be back on campus and in our new space. We look forward to seeing you at the new Scholarly Commons!

Automated Live Captions for Virtual and In-Person Meetings

At the University of Illinois at Urbana-Champaign, we are starting to think about what life will look like with a return of in-person services, meetings, and events. Many of us are considering what lessons we want to keep from our time conducting these activities online to make the return to in-person as inclusive as possible.

Main library reading room

“Mainlibraryreadingroom.jpg.” C. E. Crane, licensed under a CC-BY 2.0 Attribution license.

One way to make your meetings and presentations accessible is the use of live, automated captions. Captions benefit those who are hard-of-hearing, those who prefer to read the captions while listening to help focus, people whose first language is not English, and others. Over the course of the last year, several online platforms have introduced or enhanced features that create live captions for both virtual and in-person meetings.

Live Captions for Virtual Meetings and Presentations

Most of the major virtual meeting platforms have implemented automated live captioning services.

Zoom

Zoom gives you the option using either live, automated captions or assigning someone to create manual captions. Zoom’s live transcriptions only support US English and can be affected by background noise, so they recommend using manual captioner to ensure you are meeting accessibility guidelines. You can also integrate a third-party captioning software if you prefer.

Microsoft Teams

MS Teams offers live captions in US English and includes some features that allow captions to be attributed to individual speakers. Their live captioning service automatically filters out profane language and is available on the mobile app.

Google Meet

Unlike Zoom and Teams, Google Meet offers live captions in French, German, Portuguese, and Spanish (both Latin America and Spain). This feature is also available on the Google Meet app for Android, iPhone, and iPad.

Slack

Slack currently does not offer live automated captions during meetings.

Icon of laptop open with four people in different qudrants representing an online meeting

“Meeting” by Nawicon from the Noun Project.

Live Captions for In-Person Presentations

After our meetings and presentations return to in-person, we can still incorporate live captions whenever possible to make our meetings more accessible. This works best when a single speaker is presenting to a group.

PowerPoint

PowerPoint’s live captioning feature allows your live presentation to be automatically transcribed and displayed on your presentation slides. The captions can be displayed in either the speaker’s native language or translated into other languages. Presenters can also adjust how the captions display on the screen.

Google Slides

The captioning feature in Google slides is limited to US English and works best with a single speaker. Captions can be turned on during the presentation but do now allow for the presenter to customize their appearance.

Icon of four figures around a table in front of a blamk presentation screen

“Meeting”. by IconforYou from the Noun Project.

As we return to some degree of normalcy, we can push ourselves to imagine creative ways to take the benefits of online gathering with us into the future. The inclusive practice we have adopted don’t need to just disappear, especially as technology and our ways of working continue to adapt.