Introducing Drop-In Consultation Hours at the Scholarly Commons!

Do you have a burning question about data management, copyright, or even how to work Adobe Photoshop but do not have the time to set up an appointment? This semester, the Scholarly Commons is happy to introduce our new drop-in consultation hours! Each weekday, we will have an expert from a different scholarly subject have an open hour or two where you can bring any question you have about that’s expert’s specialty. These will all take place in room 220 in the Main Library in Group Room A (right next to the Scholarly Commons help desk). Here is more about each session:


Mondays 11 AM – 1 PM: Data Management with Sandi Caldrone

This is a photo of Sandi Caldrone, who works for Research Data Services and will be hosting the Monday consultation hours from 11 AM - 1 PMStarting us off, we have Sandi Caldrone from Research Data Services offering consultation hours on data management. Sandi can help with topics such as creating a data management plan, organizing/storing your data, data curation, and more. She can also help with questions around the Illinois Data Bank and the Dryad Repository.


Tuesdays 11 AM – 1 PM: GIS with Wenjie Wang

Next up, we have Wenjie Wang from the Scholarly Commons to offer consultation about Geographic Information Systems (GIS). Have a question about geocoding, geospatial analysis, or even where to locate GIS data? Wenjie can help! He can also answer any questions related to using ArcGIS or QGIS.


Wednesdays 11 AM – 12 PM: Copyright with Sara Benson

This is a photo of Copyright Librarian Sara Benson who will be hosting the Wednesday consultation hours from 11 AM - 12 PM
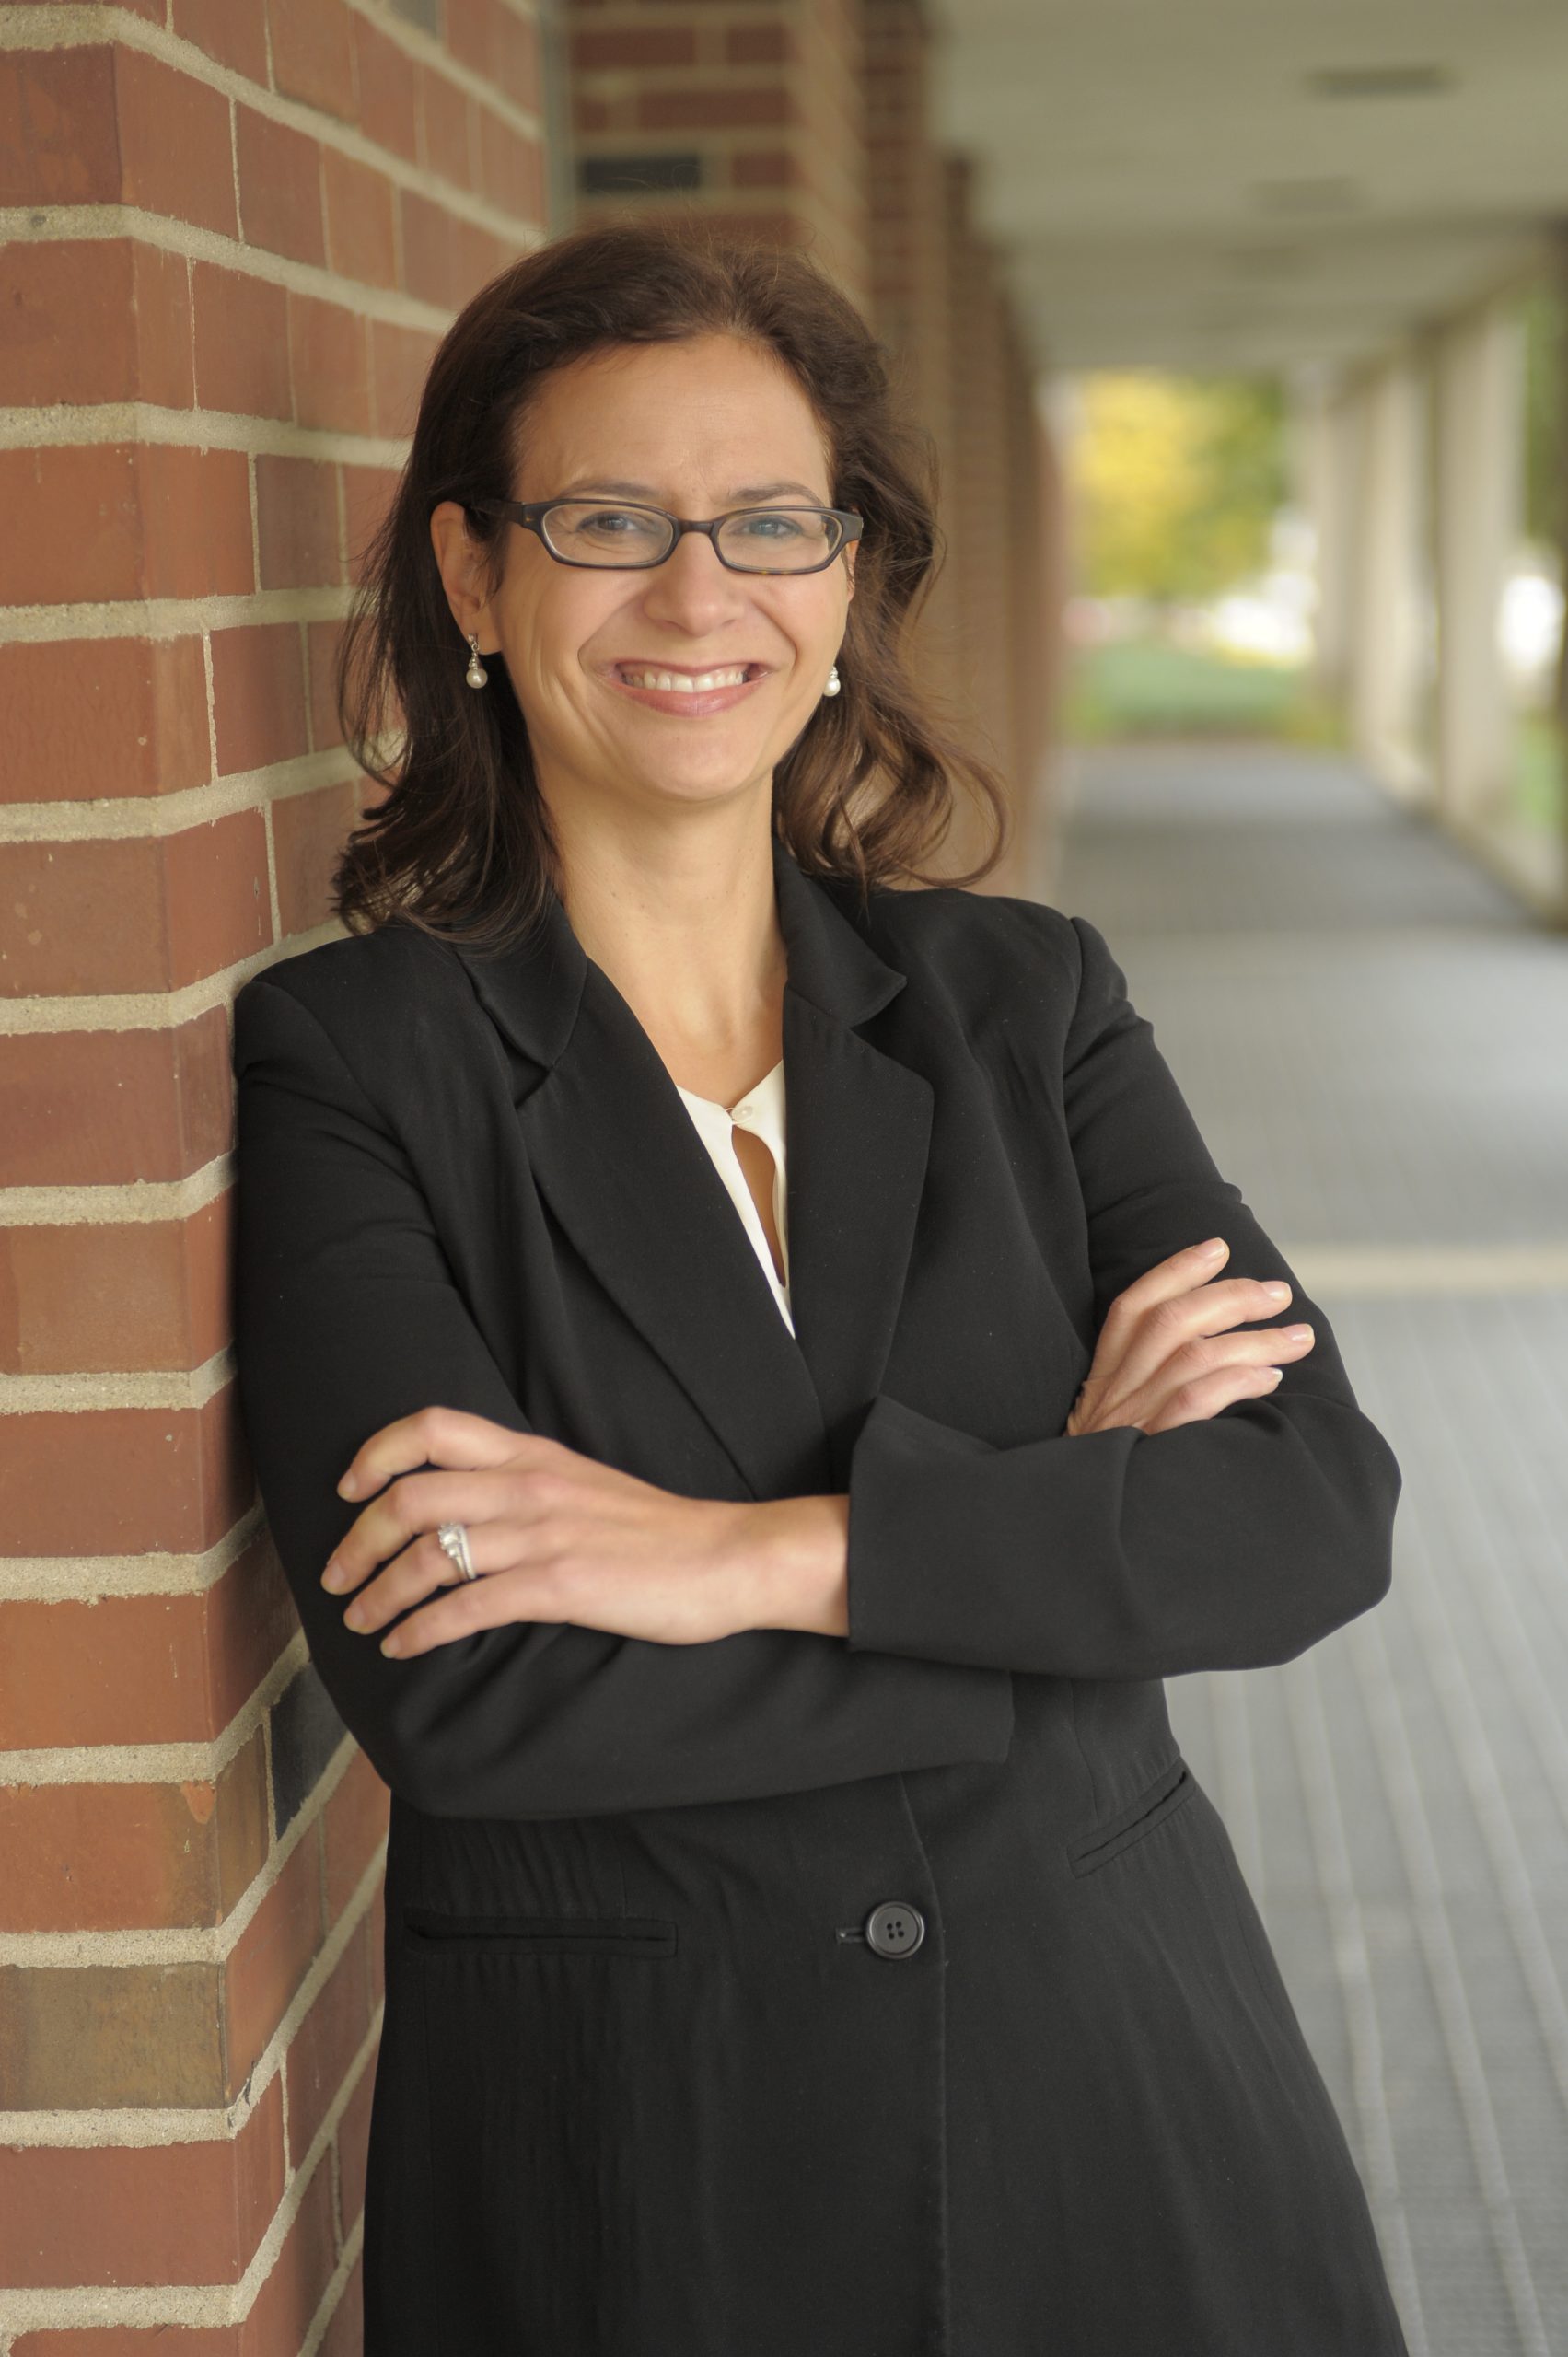
Do you have questions relating to copyright and your dissertation, negotiating an author’s agreement, or seeking permission to include an image in your own work? Feel free to drop in during Copyright Librarian Sara Benson’s open copyright hours to discuss any copyright questions you may have.


Thursdays 1-3 PM: Qualitative Data Analysis with Jess Hagman

This is a photo of Jess Hagman, who works for the Social Science, Education, and Health Library and will be hosting the Thursday consultation hours from 1 PM - 3 PMJess Hagman from the Social Science, Health, and Education Library is here to help with questions related to performing qualitative data analysis (QDA). She can walk you through any stage of the qualitative data analysis process regardless of data or methodology. She can also assist in operating QDA software including NVivo, Atlas.ti, MAXQDA, Taguette, and many more! For more information, you can also visit the qualitative data analysis LibGuide.


Fridays 10 AM – 12 PM: Graphic Design and Multimedia with JP Goguen

To end the week, we have JP Goguen from the Scholarly/Media Commons with consultation hours related to graphic design and multimedia. Come to JP with any questions you may have about design or photo/video editing. You can also bring JP any questions related to software found on the Adobe Creative Cloud (such as Photoshop, InDesign, Premiere Pro, etc.).


Have another Scholarly Inquiry?

If there is another service you need help with, you are always welcome to stop by the Scholarly Commons help desk in room 220 of the Main Library between 10 AM – 6 PM Monday-Friday. From here, we can get you in contact with another specialist to guide you through your research inquiry. Whatever your question may be, we are happy to help you!

Halloween Data Visualizations!

It’s that time of year where everyone starts to enjoy all things spooky and scary – haunted houses, pumpkin picking, scary movies and…data visualizations! To celebrate Halloween, we have created a couple of data visualizations from a bunch of data sets. We hope you enjoy them!

Halloween Costumes

How do you decide what Halloween costume you wear? Halloween Costumes conducted a survey on this very topic. According to their data, the top way people choose their costume is based on what is easiest to make. Other inspirations include classic costumes, coordination with others, social media trends, and characters from either recent or classic movie or tv franchises.

Data on how people choose their Halloween Costumes. 39% of people base it on the easiest costume they can find, 21% on classic costumes (such as ghosts, witches, etc.), 14% on recent TV or movie characters, another 14% on couples/group/family coordination, 12% on older TV or movie characters, and 11% on social media trends.

The National Retail Federation also conducted a survey of the top costumes that adults were expected to wear in 2019 (there were no good data sets for 2020…). According to the survey, the most popular Halloween costume that year was a witch. Other classic costumes, such as vampires, zombies, and ghosts, ranked high too. Superheroes were also a popular costume choice, with many people dressing up as Spider-man or another Avengers character.


Data on the top 10 costumes of 2019. The top choice was dressing up as a witch, followed by a vampire, superhero, pirate, zombie, ghost, avengers character, princess, cat, and Spider-man.


Halloween Spending and Production

According to the National Retail Federation, Halloween spending has significantly increased between 2005 to this year, with the expected spending this year surpassing 10 billion dollars! That is up from fifteen years ago when the estimated Halloween spending averaged around 5 billion dollars.


This is data on expected Halloween spending between 2005 and 2021. In 2005, the expected spending was 3.3 Billion dollars. In 2006, it was 5 billion dollars. In 2007, it was 5.1 billion dollars. In 2008, it was 5.8 billion dollars. In 2009, it was 4.7 billion dollars. In 2010, it was 5.8 billion dollars again. In 2011, it was 6.9 billion dollars. In 2012, it was 8 billion dollars. In 2013, it was 7 billion dollars. In 2014, it was 7.4 billion dollars. In 2015, it was 6.9 billion dollars. In 2016, it was 8.4 billion dollars. In 2017, it was 9.1 billion dollars. In 2018, it was 9 billion dollars. In 2020, it was 8 billion dollars. Finally, in 2021, it is expected to be 10.1 billion dollars.

With much spending invested in Halloween, it would make sense that the production of Halloween-related items would likely grow too to meet this demand. The U.S. Department of Agriculture records each year the number of pumpkins produced in the United States. Besides one dip taken in 2015, it appears that pumpkin production has almost doubled in the past twenty years on average.


This is data on the number of pumpkins produced in the United States every year. In 2001, it was 8,460,000 pumpkins produced. In 2002, 8,509,000 Pumpkins were produced. In 2003, 8,085,000 pumpkins were produced. In 2004, 10,135,000 pumpkins were produced. In 2005, 10,756,000 pumpkins were produced. In 2006, 10,484,000 pumpkins were produced, in 2007, 11,458,000 pumpkins were produced. In 2008, 10,663,000 pumpkins were prodcued. In 2009, 9,311,000 pumpkins were produced. In 2010, 10,748,000 pumpkins were produced. In 2011, 10,705,000 pumpkins were produced. In 2012, 12,036,000 pumpkins were produced. In 2013, 11,221,000 pumpkins were prodcued. In 2014m 13,143,000 pumpkins were produced. In 2015, 7,538,000 pumpkins were prodcued. In 2016, 17,096,500 pumpkins were produced. In 2017, 15,600,600 pumpkins were produced. In 2018, 15,406,900 pumpkins were produced. In 2019, 13,450,900 pumpkins were produced. Finally, in 2020,, 13,751,500 pumpkins were produced.

Halloween Activities by Demographics

Finally, here are two statistics taken from the National Retail Federation again regarding how people celebrate activities based on age and region. As the data shows, younger people seem more likely to dress in costumes, visit haunted houses, or throw parties on Halloween. Meanwhile, older individuals are more likely to decorate their homes or hand out candy.

This is data about how people celebrate different Halloween activities by age. Those 65 and older are only 31% likely to carve a pumpkin (31%) as opposed to the 43-50% likelihood of other age groups. Those 55-64 are the most likely to decorate their homes/yard (58%) while 18-24 are the least likely (47%). Those 18-24 years old, however, are the most likely to dress in costume (69%) while only 18% of those 65 and older will dress in costumes. Those 25-34 are the most likely to dress their pets up at 30% with only 8% of those 65 and older doing the same. Those 65 and older are 81% likely to hand out candy, however, while only 51% of people 18-24 years of age will pass out candy. Those at ages 35-44 are 38% likely to take their children trick-or-treating, while only 13% of those 65 and older do so. The 18-24 year old demographic are the most likely to throw or attend a party (43%), while 11% of those 65 and older do the same. Similarly, 18-24 demographic are the most likely to attend a haunted house at 32% while only 3% of those in the 65 and older range do the same.

At the same time, there seems to be not too huge of a difference in celebrating by region, apart from those living on the west coast being more likely to dress up or those living in the northeast more likely to hand out candy. Other than those two differences, it seems that most regions celebrate the same Halloween activities in the same proportions.

This is data about how people celebrate different Halloween activities by region. 42-46% of people carve a pumpkin (with those in the Midwest on the higher end and the South on the lower end). 50-54% of people decorate their home or yard with the Midwest and Northeast on the higher end and the South on the lower end. 41-52% of people dress in costume with those living in the West on the higher end and the Midwest on the lower end. 19-22% of people dress their pets with those living in the West on the higher end and the Midwest on the lower end. 64-70% of people hand out candy with the Northeast on the higher end and the West and South tied on the lower end. 22-26% of people take their children trick-or treating with those living in the Midwest and South on the higher end and the West on the lower end. 25% of people throw or attend a party equally across regions. 17-19% of people visit a haunted house with the Midwest and South on the higher end and the West on the lower end.


We hope these data visualizations got you in the mood for spooky, Halloween fun! From all of us at the Scholarly Commons, Happy Halloween!

What Are the Digital Humanities?

Introduction

As new technology has revolutionized the ways all fields gather information, scholars have integrated the use of digital software to enhance traditional models of research. While digital software may seem only relevant in scientific research, digital projects play a crucial role in disciplines not traditionally associated with computer science. One of the biggest digital initiatives actually takes place in fields such as English, History, Philosophy, and more in what is known as the digital humanities. The digital humanities are an innovative way to incorporate digital data and computer science within the confines of humanities-based research. Although some aspects of the digital humanities are exclusive to specific fields, most digital humanities projects are interdisciplinary in nature. Below are three general impacts that projects within the digital humanities have enhanced the approaches to humanities research for scholars in these fields.

Digital Access to Resources

Digital access is a way of taking items necessary for humanities research and creating a system where users can easily access these resources. This work involves digitizing physical items and formatting them to store them on a database that permits access to its contents. Since some of these databases may hold thousands or millions of items, digital humanists also work to find ways so that users may locate these specific items quickly and easily. Thus, digital access requires both the digitization of physical items and their storage on a database as well as creating a path for scholars to find them for research purposes.

Providing Tools to Enhance Interpretation of Data and Sources

The digital humanities can also change how we can interpret sources and other items used in the digital humanities. Data Visualization software, for example, helps simplify large, complex datasets and presents this data in ways more visually appealing. Likewise, text mining software uncovers trends through analyzing text that potentially saves hours or even days for digital humanists had they analyzed the text through analog methods. Finally, Geographic Information Systems (GIS) software allows for users working on humanities projects to create special types of maps that can both assist in visualizing and analyzing data. These software programs and more have dramatically transformed the ways digital humanists interpret and visualize their research.

Digital Publishing

The digital humanities have opened new opportunities for scholars to publish their work. In some cases, digital publishing is simply digitizing an article or item in print to expand the reach of a given publication to readers who may not have direct access to the physical version. Other times, some digital publishing initiatives publish research that is only accessible in a digital format. One benefit to digital publishing is that it opens more opportunities for scholars to publish their research and expands the audience for their research than just publishing in print. As a result, the digital humanities provide scholars more opportunities to publish their research while also expanding the reach of their publications.

How Can I Learn More About the Digital Humanities?

There are many ways to get involved both at the University of Illinois as well as around the globe. Here is just a list of a few examples that can help you get started on your own digital humanities project:

  • HathiTrust is a partnership through the Big Ten Academic Alliance that holds over 17 million items in its collection.
  • Internet Archive is a public, multimedia database that allows for open access to a wide range of materials.
  • The Scholarly Commons page on the digital humanities offers many of the tools used for data visualization, text mining, GIS software, and other resources that enhance analysis within a humanities project. There are also a couple of upcoming Savvy Researcher workshops that will go over how to use software used in the digital humanities
  • Sourcelab is an initiative through the History Department that works to publish and preserve digital history projects. Many other humanities fields have equivalents to Sourcelab that serves the specific needs of a given discipline.

Introductions: What is Data Analysis, anyway?

This post is part of a series where we introduce you to the various topics that we cover in the Scholarly Commons. Maybe you’re new to the field or you’re just to the point where you’re just too afraid to ask… Fear not! We are here to take it back to the basics!

So, what is Data Analysis, anyway?

Data analysis is the process of examining, cleaning, transforming, and modeling data in order to make discoveries and, in many cases, support decision making. One key part of the data analysis process is separating the signal (meaningful information you are trying to discover) from the noise (random, meaningless variation) in the data.

The form and methods of data analysis can vary widely, and some form of data analysis is present in nearly every academic field. Here are some examples of data analysis projects:

  • Taylor Arnold, Lauren Tilton, and Annie Berke in “Visual Style in Two Network Era Sitcoms” (2019) used large-scale facial recognition and image analysis to examine the centrality of characters in the 1960s sitcoms Bewitched and I Dream of Jeannie. They found that Samantha is the distinctive lead character of Bewitched, while Jeannie is positioned under the domination of Tony in I Dream of Jeannie.
  • Allen Kim, Charuta Pethe, Steven Skiena in “What time is it? Temporal Analysis of Novels(2020) used the full text of 52,183 fiction books from Project Gutenberg and the HaithiTrust to examine the time of day that events in the book took place during. They found that events from 11pm to 1am became more common after 1880, which the authors attribute to the invention of electric lighting.
  • Wouter Haverals and Lindsey Geybels in “A digital inquiry into the age of the implied readership of the Harry Potter series” (2021) used various statistical methods to examine whether the Harry Potter books did in fact progressively become more mature and adult with successive books, as often believed by literature scholars and reviewers. While they did find that the text of the books implied a more advanced reader with later books, the change was perhaps not as large as would be expected.

How can Scholarly Commons help?

If all of this is new to you, don’t worry! The Scholarly Commons can help you get started.

Here are various aspects of our data services in the Scholarly Commons:

As always, if you’re interested in learning more about data analysis and how to support your own projects you can fill out a consultation request form, attend a Savvy Researcher Workshop, Live Chat with us on Ask a Librarian, or send us an email. We are always happy to help!

Introductions: What is GIS, anyways?

This post is part of a series where we introduce you to the various topics that we cover in the Scholarly Commons. Maybe you’re new to the field or you’re just to the point where you’re just too afraid to ask… Fear not! We are here to take it back to the basics!

So, what is GIS, anyways?

Geographic Information Systems, or GIS as it is often referred to, is a way of gathering, maintaining, and analyzing data. GIS uses geography and spatial data to create visualizations using maps. This is a very useful way to analyze your data to identify and understand trends, relationships, and patterns in your data over a geographic region. Simply put, it is a way of visualizing data geographically and the key to GIS is in spatial data. In addition to spatial data, there is attribute data which is basically any other data as it relates to the spatial data. For example, if you were looking at the University of Illinois campus, the actual location of the buildings would be spatial data, while the type of building (i.e. an academic, laboratory, recreation, etc) would be attribute data. Using these two types of data together can allow researchers to explore and answer difficult questions.

While it can get more complex than that, since this is an introductions series, we won’t go into the fine details. If you want to learn more about GIS and the projects you can do with it, you can reach out to the Scholarly Common’s GIS Specialist, Wenjie Wang.

So, who uses GIS?

Anyone can use GIS! You can use maps to visualize your data to identify problems, monitor change, set priorities, and forecast fluctuations.

There are GIS technologies and applications that assist researchers in performing GIS. The Scholarly Commons has a wide range of GIS resources, including software that you can access from your own computer and a directory of geospatial data available throughout the web and University Library resources. 

If you’re interested in learning more about GIS application and software and how to apply it to your own projects you can fill out a consultation request formattend a Savvy Researcher WorkshopLive Chat with us on Ask a Librarian, or send us an email. We are always happy to help!


References

Dempsey, C. (2019, August 16). What is GIS? GIS Lounge. https://www.gislounge.com/what-is-gis/

What is GIS? | Geographic Information System Mapping Technology. (n.d.). Retrieved April 19, 2021, from https://www.esri.com/en-us/what-is-gis/overview