Conservation Drainage is the incorporation of environmentally friendly practices and structures into existing drainage infrastructure.These practices lead to the optimization of drainage practices for water quality objectives. In light of the importance of drainage to agriculture in the state, conservation drainage practices (CDPs) should reduce nutrient transport from drained land without adversely affecting drainage performance or crop production. The practices mentioned below satisfies this criterion.
Subsurface bioreactors
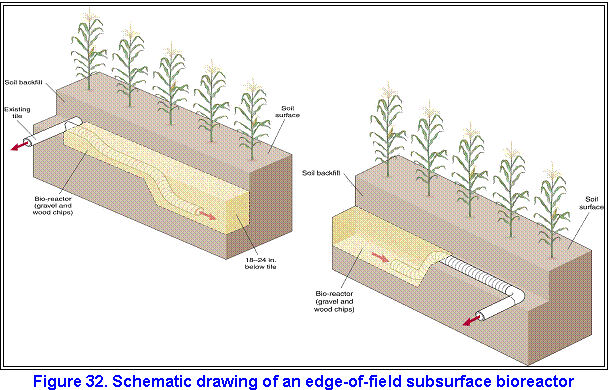
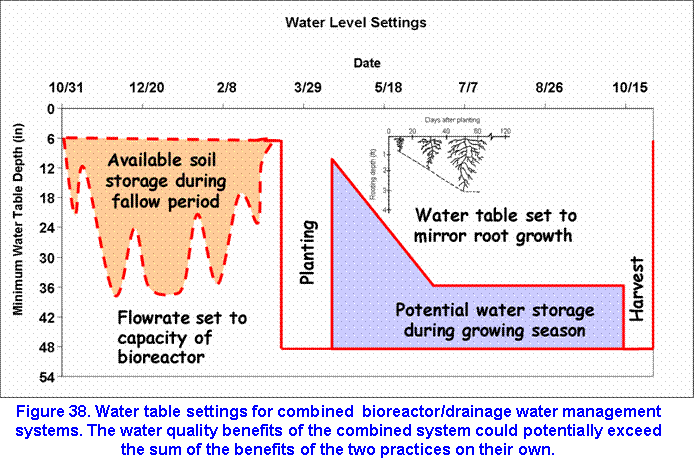
Bioreactors are essentially subsurface trenches filled with a carbon source, mainly wood chips, through which water is allowed to flow just before leaving the drain to enter a surface water body. The carbon source in the trench serves as a substrate for bacteria that break down the nitrate through denitrification or other biochemical processes (Figure 32).
Bioreactors provide many advantages:
They use proven technology
They require no modification of current practices
No land needs to be taken out of production
There is no decrease in drainage effectiveness
They require little or no maintenance
They last for up to 20 years.
To ensure that there is no decrease in drainage effectiveness, water is allowed to bypass the system when the tile flow rate exceeds the flow capacity of the bioreactor. Typically, only 20 – 30% of the annual tile flow passes through the bioreactor and is treated. Most of the flow bypasses the bioreactor during high-flow events.
Bioreactors have no adverse effects on production. They are designed such that they do not restrict drainage. Unlike other edge-of-field practices such as wetlands or buffer strips, they do not necessitate taking land out of production.They are also very cost effective. However, there are no financial incentive for a producer to install one of these systems. Like other conservation practices such as wetlands and buffer strips, it is expected that as these systems are further developed they will be considered worthy of public funding.
Water table management
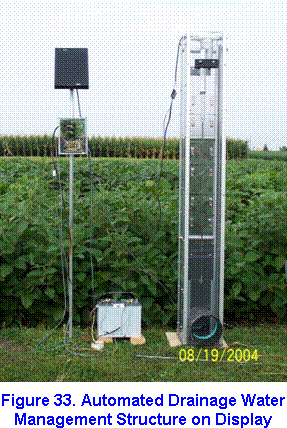
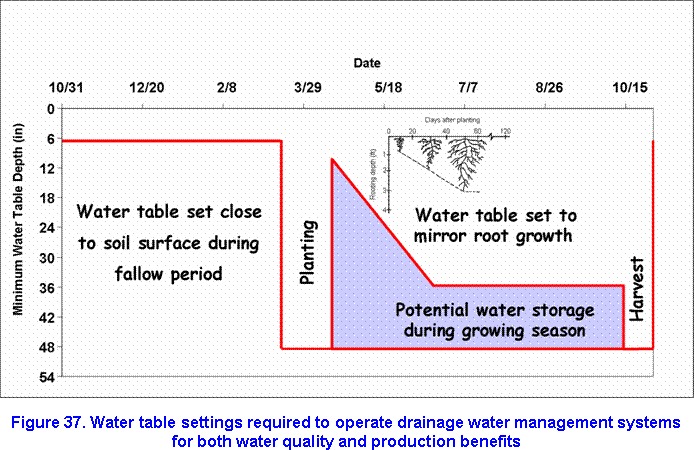
In drainage water management, a control structure (Figure 33 ) is placed at the outlet of a tile system to control the level of the water table in the soil. This practice can be used to raise the water level after harvest, thereby reducing nitrate loading from tile effluent, or to retain water in the soil during the growing season. The normal mode of operation in Illinois is to set the water table control height to within 6 inches of the soil surface on November 1, and to lower the control height to the level of the tile on March 15. Thus, water is held back in the field during the fallow period. In experiments in Illinois, reductions of up to 82.5 % and 46.6 % were measured for phosphate (Figure 34) and nitrate (Figure 35), respectively .
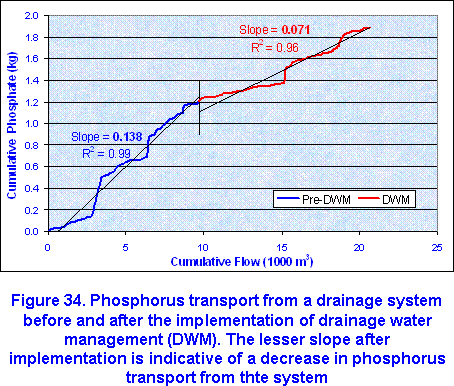
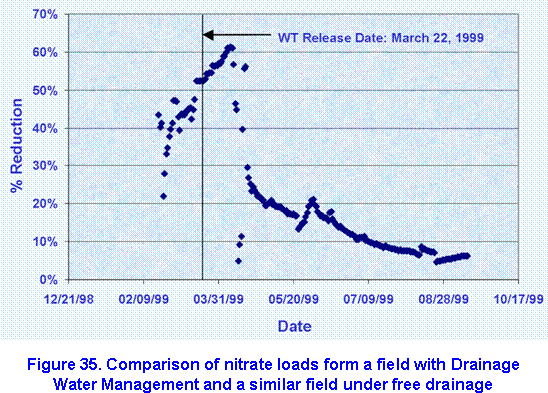
Analysis of phosphorus data is complicated by the fact that there are a few events in which inordinately large amounts of phosphorus are transported through the drains. It is surmised that these events result from preferential flow and experiments to further explicate this phenomenon have been initiated. The dominant mechanism for nitrate reduction is not denitrification, but the reduction of flow volumes that result from implementing drainage water management.
Existing drainage systems can be retrofitted for drainage water management by installing control structures at a cost of$20 – $40 per acre. For new systems addition costs are incurred by laying out the drainage systems to optimize the benefits of drainage water management.
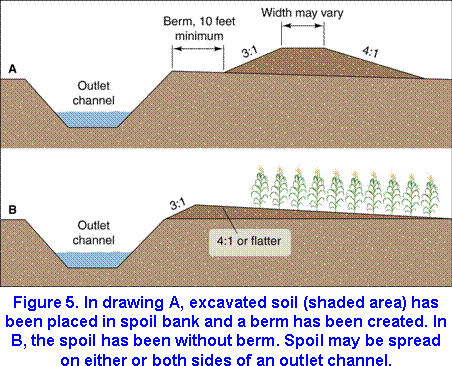
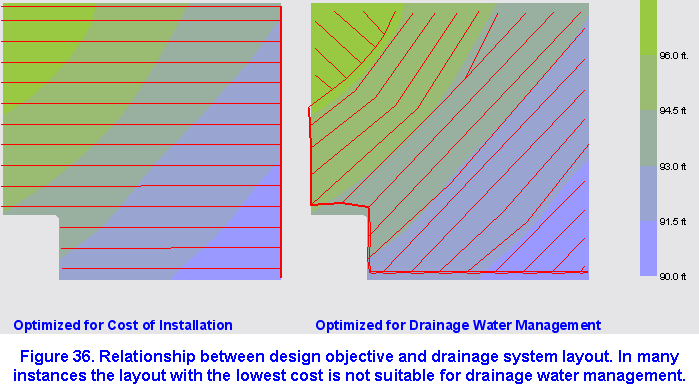
In Illinois, drainage systems are normally laid out to minimize the cost of installation. However , such installations do not necessarily maximize the benefits of drainage water management. Shown in Figure 5 are two possible drainage systems that could be installed on the same field. In all likelihood, this lower cost system would be the one selected for installation. In this instance, based on average installations costs, the difference in cost is $75/acre.
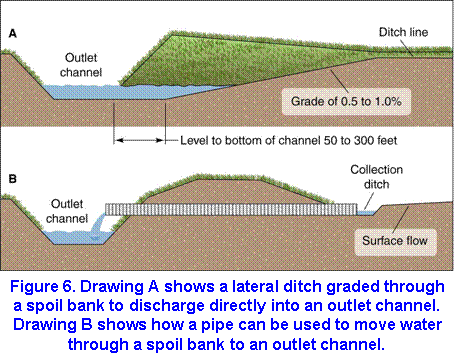
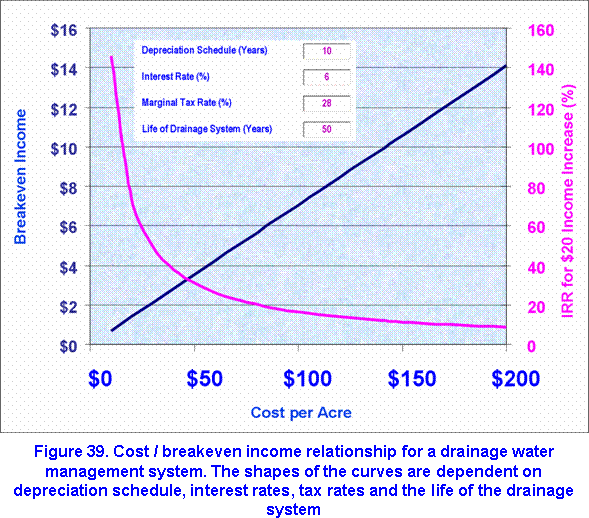
Drainage water management systems can be managed so that they store water during the growing season (Figure 6). This stored water can result in increased yields. One relationship between the additional cost of a drainage water management system and the corresponding breakeven income is shown in Figure 7.A system that cost $100/acre, for example, has a breakeven income of $7.05. Thus, it does not take a large yield increase to pay for the installation of a drainage water management system(Figure 36) (Figure 37) (Figure 38).(Figure 39)
Depth/Spacing Modifications
Originally, tile systems in Illinois were designed for the sole purpose of quickly removing excess water from the plant root zone to prevent wet stress and to improve crop yields.Drainage intensity is expressed as the drainage coefficient, the depth of water to be drained to lower a water table, initially at the soil surface, by a foot in 24 hours.Different combinations of depth and spacing result in the same drainage coefficient (Figure 40 ), but they may be different in their water quality response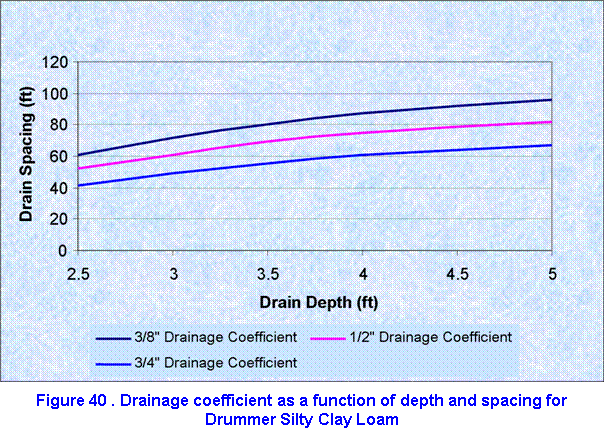
 .
.
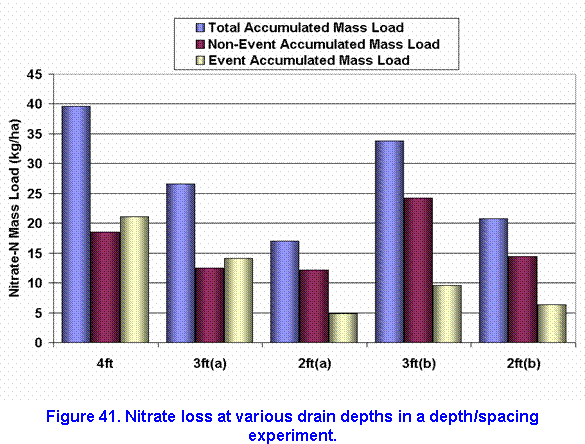
Experiments are being conducted on several different soil types to determine depth/spacing combinations that optimize productivity with minimum adverse water quality effects.Preliminary results, shown in Figure 41 ,seem to suggest that shallower tiles placed closer together are more suitable than deeper tiles placed farther apart.
For a specified drainage coefficient, shallower tile are associated with narrower spacings and thus drainage cost increases with decreasing tile depth.
The relationship between spacing and average installation cost is shown in Figure 10. Also shown is the relationship between computer simulated yield from a silt loam and spacing, using 30 years of weather data from Urbana. While the yield ratio varies with soil type and location, and the cost ratio varies with the contractor, the general form of the curves are representative of what can be expected in Illinois. Note that there is a threshold spacing beyond which no yield benefits can be obtained by putting the tiles closer together.
The yield and the cost curves can be used to determine the spacing that maximizes the rate of return on the investment in drainage. In this instance the maximum rate of return was 17%, obtained at a spacing of 45 ft. If the spacing were reduced to 35 ft so as to improve the quality of the drain effluent, the rate of return on the drainage investment would drop to 15%. This is still a substantial rate of return for the producer. Further benefits would also accrue from the improvement in downstream water quality.
Conclusions
Conservation drainage practices are designed to provide water quality benefits. They are most likely to be adopted if they do not adversely affect profits. Some practices can be managed to provide production benefits. If these benefits exceed the costs then there is economic incentive to implement these practices