
Big data has to be one of the most prominent buzzwords in 2010s. Hundreds of thousands of job postings are actively searching for “business analysts, data scientists, or candidates with experience in big data, data modeling, database management, data etc.” Just about every single one of my management information systems core classes touch upon big data in someway shape or form. And most importantly, employers and recruiters begin to view a candidate as a god in an interview when they have legitimate exposure and practical work experience in big data.
Big data is no joke and here are some reasons why its implications are dominating and molding the business world: Every 2 days humans create the same amount of data that was created from 2003 back to the beginning of the time. The total amount of data being successfully captured and stored doubles every 1.2 years. And my favorite statistic stems from the fact that would anyone expect anything different with 204 million emails, 1.8 million facebook likes, 278k tweets, 2.4 million google searches generated and 100 hours of uploaded Youtube video content every minute?
Look here for those crazy statistics!
With all this being said, everyone knows that 3-D printing is just as revolutionary and innovative as the rapid and exponential rise of big data. Thus, the new question that comes to hand is how 3D printing complements big data. The implications of 3D printing and big data are limitless in: 1. Data Visualization and 2. Monitoring Manufacturing
Data Visualization
While data is being relentless generated and recorded, data is meaningless if it cannot be effectively and properly interpreted and understood. This represents the constant struggle of data rich information poor. Tableau, Microsoft BI, and Qlik were all so groundbreaking because data was able to be represented in a way that was easily interpreted by all audiences. With very aesthetically appealing, comprehensive, and in depth visualizations, Tableau, Power BI, and Qlik allow a consumer to easily showcase business solutions and stories are easily told from the tips of their fingers. 3D printing takes visualization to a whole new level of in-depth analysis and even further simplifies and more explicitly illustrates the story the author is trying to tell. 3D printed visualizations yield better pattern recognition, deeper information absorption, and ignite excitement within the audience. This application of 3D printing in Data Visualization is lucidly demonstrated in MIT Researchers’ Zachary Weber Vijay Gadepally’s MIT-campus twitter activity visualization model. Zachary and Vijay are catalyzing the implication of geographical data visualization and 3D printing and attached is a picture:
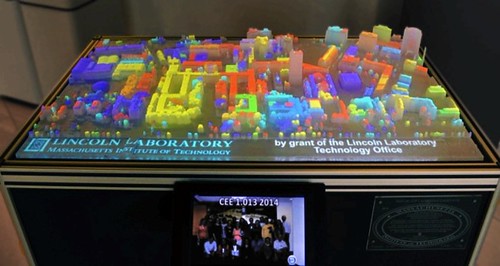
In MIT Technology Review’s How 3-D Printing is Revolutionizing the Display of Big Data, Weber and Gadepally began by printing and 3D model of MIT’s campus. From here, Weber and Gadepally cleaned and prepared Twitter data was specifically geolocated on MIT’s campus. Thus, Weber and Gadepally overlaid the stream of Twitter data to their MIT campus 3D printed model and easily illustrated “twitter volume as a function of time and space to provide insight into campus patterns or life.”
However, the most powerful part of Zachary and Vijay’s model was not just measuring volume of campus tweets but most importantly integrating an interactive screen that allows the end-user to easily analyze the content of all those tweets geographically. While Zachary and Vijay’s campus model illustrates a revolutionary way to analyze and study campus behavior, the implications of their model stretch so much further. Zachary and Vijay have laid the groundwork for city planners to effectively analyze city traffic patterns, marketers to better segment target markets based on geographic locations, retailers to better place retail stores based on consumer demand, and so much more. 3D printing is so crucial and groundbreaking to data visualization going forward not only because of its geographical visualization capabilities but also because it is becoming more economical and easily accessed by the consumer. Traditionally 3D models utilized to visualize data came with astronomically high expenses and typically sat in museums developed to display only simple sets of data. However, as 3D models are becoming easier and cheaper each and every day to print and create, 3D models are the future of data visualization, business analytics, and business intelligence: with geographical models being the very tip of the iceberg.
Monitoring Manufacturing
Big Data and 3D printing have another revolutionary opportunity to complement each other in the manufacturing industry. General Electric’s Aviation sector has been integrating Big Data and 3D printing to collect and analyze data on their manufactured products to predict defects through strategic placement of sensors. Here’s a video detailing the process:
In GE Reports’s Big Data Meets 3-D Printing: Big Data to Monitor Laser-Printed Jet Parts, it becomes evident that GE Aviation has been 3D printing many of its aerospace products specifically jet nozzle components. 3D printing has allowed GE to make jet nozzles more efficiently by utilizing only one raw material part (as opposed to 20 different parts) and making its jets 5 times more durable 25% lighter. Here’s an example of the finished product:

With all this being said, Big Data is impacting GE Aviation’s 3D printing business by bolstering quality control through the development stages of GE Aviation’s jet products. Through the 3D building, printing, and laser cutting process, General Electric is consistently tracking and collecting data from sensors that are placed on all machinery involved within the process. This sensor “big data” is unrelenting fed into an algorithm that can immediately identify when problems that arise from the process: For instance, the weld pool may be too small, when certain machinery and processes should be hotter or colder than they should be, etc. Big data allows this quality control process to be so exacting and demanding to the point where every cubic millimeter of the production process is easily monitored. With the combination of Big Data and 3D printing GE Aviation has successfully implemented “in-process” inspection technology that is estimated to decrease production flow times by as much as 25%.
Monitor Manufacturing and 3D Visualization only represent the very start of 3D printing and its implications in the big data world. From learning about these two applications of 3D printing and Big Data, I am so excited to continuing learning more about the relentless possibilities of 3D printing. As I will be doing technology consulting specifically analytics consulting for IBM Global Business Services after graduation, I’m so excited for the potential possibilities of working on future projects that integrate 3D printing and big data together.