
So I decided to split this post into two parts to avoid a very long webpage.
Previously I went over
mean(clean_data$avgTemp,na.rm=T)

#This Returns

[1] 50.58537
In 1.7 All About Missing Data and Datatypes in R.
How does this work? Well reading the documentation about the mean() function
with ?mean
says
“na.rm: a logical value(True/False) indicating whether ‘NA’ values should be
stripped before the computation proceeds.”
How does R strip the NA values? With the function na.omit()
?na.omit() says this function returns the object with incomplete cases removed.
Let’s dig into this
str(na.omit(clean_data$avgTemp))

## we can see that yes the NA are omitted [1:541] 542 indices (the position of the NA in the vector or column)

## can we use na.omit to get the same result

## as mean(clean_data$avgTemp,na.rm=T)?

mean(na.omit(clean_data$avgTemp))

## yup
So now we have one option under our belts of how to deal with NA’s: remove them completely.
However this is a poor option when dealing with a time series, if you have ordered data, i.e. every second or day, na.omit() will remove days from the dataset. For a single time series as we have been working with (technically we have two as we have precip data) we won’t necessarily miss those days we will simply have less data, but for larger data sets are we throwing out good data from one variable because we are missing a lot of data in another?
Let’s check if the precipitation data is missing at the same time as temperature data.
clean_data$PRCP[is.na(clean_data$avgTemp)]
We haven’t even analyzed the precipitation data up until this point. Very quickly.
summary(clean_data$PRCP)

#We can see that the bad data flag is clearly -999.900.

#So.. set those to NA

clean_data$PRCP[clean_data$PRCP==-999.9]=NA
There are only 25 missing days of data for precipitation but 542 days of temperature. So yes we will be removing a lot of good precipitation data if we try and omit the NA from the temperature data in the dataframe.
## if we want to omit NA from the data frame...

#clean_data=na.omit(clean_data)

## but we don't so just examine the output

str(na.omit(clean_data))
Examining the output using str() we can see that we will throwing out 566 days of data, which is hardly acceptable especially as the data frame will be missing a lot (well 2% in total) of temperature and precipitation data, especially from recent years.
So what are some other options?
Well we really only have one other option: either we omit (or ignore the NA’s present) or we fill in the missing data somehow.
Let’s explore filling in missing data. The best package I have found to fill in missing data is with the Zoo package, so if you don’t have it.
 ### first install it (you only need to do this once)

install.packages('zoo')

### then load it up

require(zoo)
In zoo there are a few more NA functions in particular:
na.locf()

na.appox()

na.spline()
Let’s explore these functions on a vector with some missing data and plots.
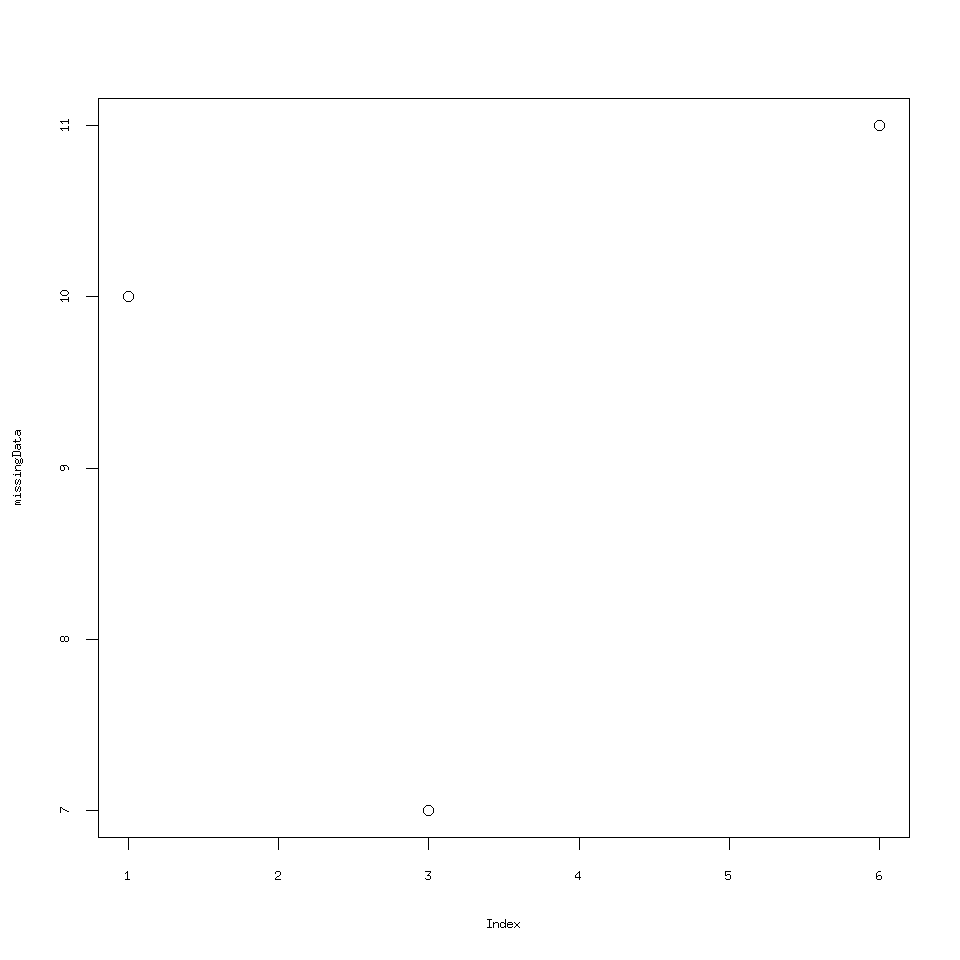
missingData=c(10,NA,7,NA,NA,11)

plot(missingData)
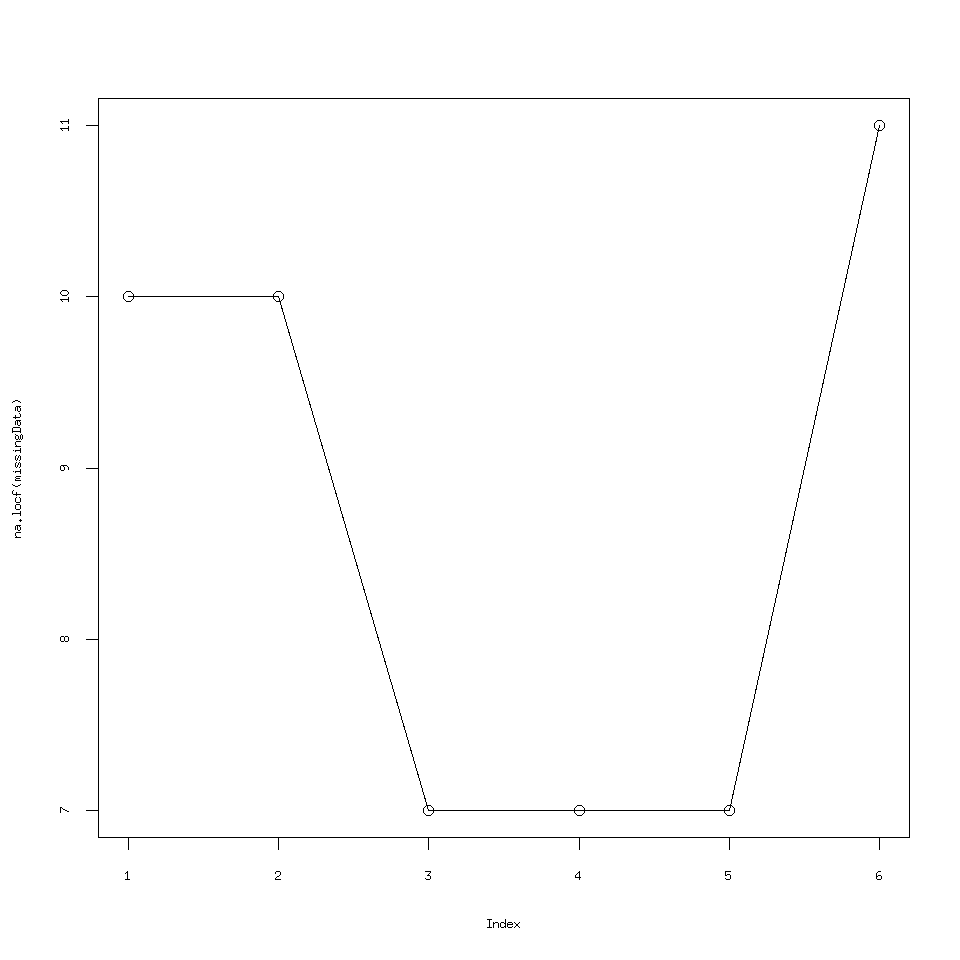
na.locf() stands for last observation carried forward and does just what it says the last observation before NA or a string of NA is used to replace the NA
for example if you have 10,NA,7,NA,NA,NA then this will output 10,10,7,7,7 you can even test this after loading zoo
 na.locf(missingData)

plot( na.locf(missingData),type='l')

points(na.locf(missingData))
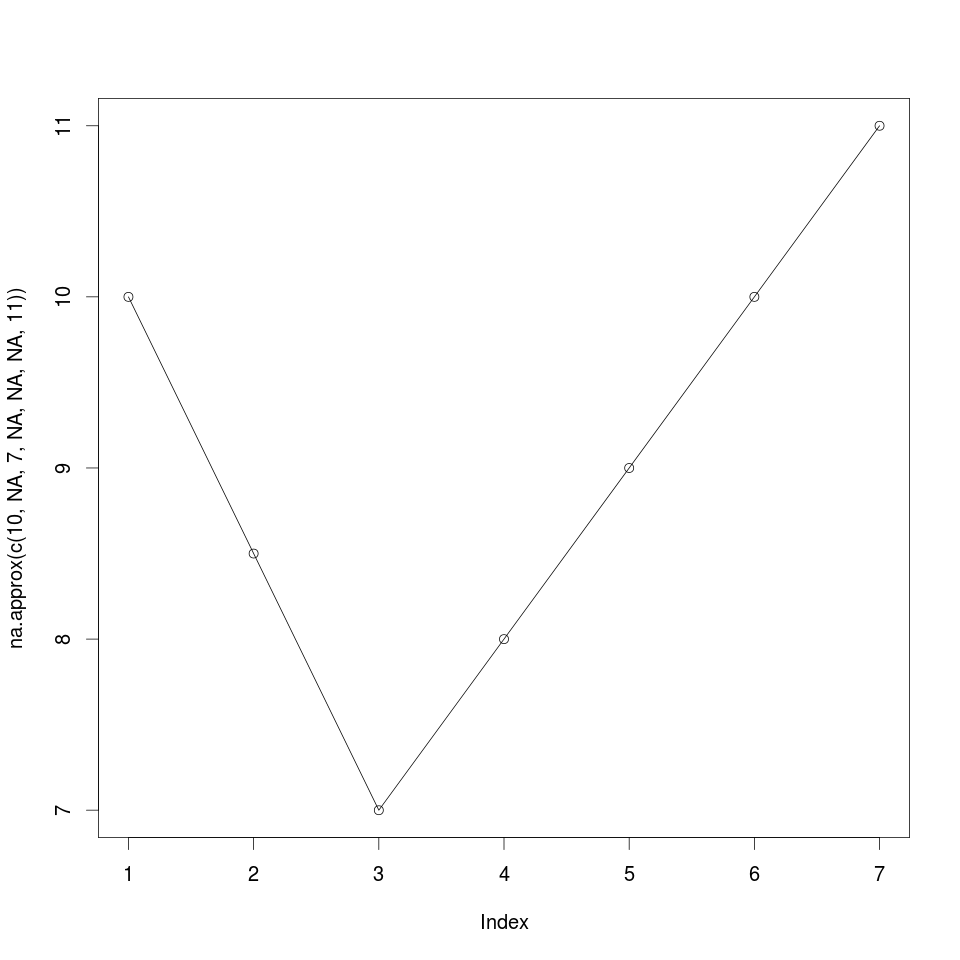
na.approx() uses linear interpolation to fill in missing data try
na.approx(c(10,NA,7,NA,NA,NA,11))

#this returns

[1] "10.0  8.5  7.0  8.0  9.0 10.0 11.0"

plot(na.approx(missingData))
na.spline() uses polynomial interpolation to fill in missing data. Let’s explore spline interpolation.
na.spline(c(10,NA,7,NA,NA,NA,11))

plot(na.spline(missingData),type='l')

points(na.spline(missingData))
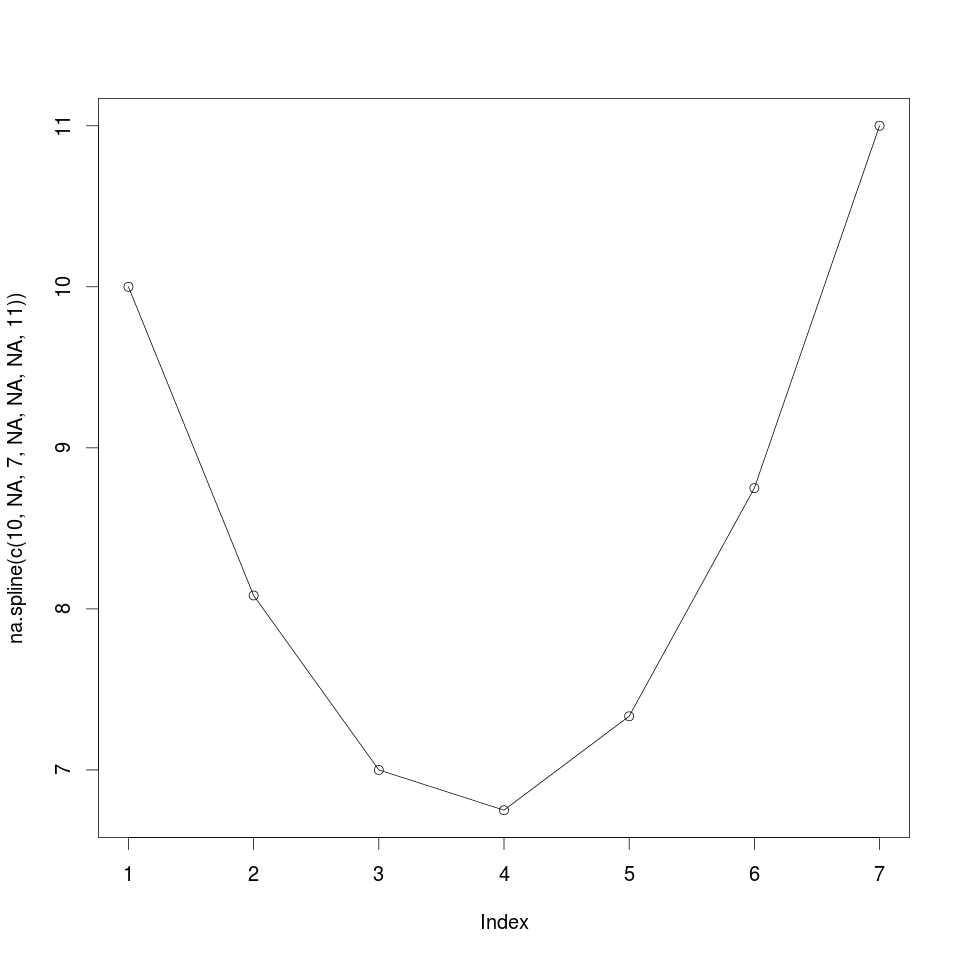
I was very impressed with the capabilities for NA interpolation from R (well the zoo package) once I started working with the above functions.
Based on my experiences let’s try na.spline() on the temperature data and see how that looks, this would be my go to option if I was missing some hours of temperature in an hourly temperature record, because hourly temperature has a daily cycle to it, polynomial splining would be extremely appropriate.
Continued in Part 2.
2. Dealing with Missing Data in R: Omit, Approx, or Spline Part 2