
So I decided to tackle the easier of my two suggested posts first. In this post we are going to explore what combinations of max and min daily temperatures give us the same daily average temperature.
So after loading the data from 2.5 Complete Recap.
Let’s explore the daily average temperature in more detail.
Previously we averaged the max and min daily temperatures to integers (-1,0,1,2…) before taking the simple average. When taking the mean of a set of numbers, as I currently understand it, we have one higher decimal place of accuracy, so the simple average should be accurate to the first decimal place. Let’s check this.
table(round(clean_data$avgTemp,1))
#A small slice of what this returns rearranged for the web page.
Temp->Freq
28.5 ->164
28.7 –>2
29 —>137
29.3 –>1
29.5 ->145
So we have most numbers either falling as integers at 0.5 (28, 28.5 , 29 , 29.5 , 30). I expect that anything else is a result of floating point division. Let’s check this.
clean_data$TMAX[clean_data$avgTemp==29.3]

#this returns

numeric(0)
which means there is no average temperature at 29.3 deg F. But if we round it.
clean_data$round_avgTemp=round(clean_data$avgTemp,1)

clean_data$TMAX[clean_data$round_avgTemp==29.3]

## returns

18.81024
Wait what? But we called round() on TMAX which by default should round to 0 decimal places. Why is it returning a decimal? Because it is type num Check this with str(clean_data$TMAX) even though it prints out integers, because it is a num variable it is actually storing decimal places so we need to convert to integer after we round.
As an aside:
3b What happens if we try converting to integer before rounding?
For sure we must convert to integer after rounding.
clean_data$TMAX=as.integer(round(clean_data$TMAX))

clean_data$TMIN=as.integer(round(clean_data$TMIN))

## then recompute the daily avg temperature

clean_data$avgTemp=((clean_data$TMAX+clean_data$TMIN)/2.0)

## then check it

table(clean_data$avgTemp)

## this returns

28.5    29     29.5

167     137     128
So the 0.3 and 0.7 we saw previously are gone now, which is great.
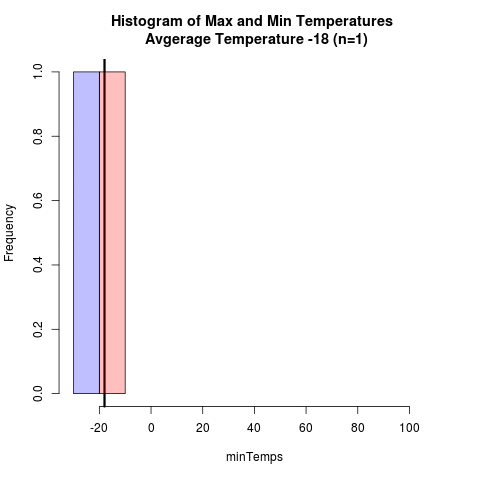
To explore which combinations of max and min temperatures give us the same daily average temperature, we are going to loop over all of the average temperatures and plot the max and min temperatures associated with the current daily average temperature.
So after playing around with this, I decided to use the R animation package to generate GIFs and save them out rather than suggest people watch the animations in the plot windows themselves. On slow computers, like the laptop I’m working on, watching the animations in the plot windows results in the graphs flashing each time they are drawn to the screen, which is just unacceptable.
So I was originally going to just post this..
Press Ctrl+C where you type R commands to kill the loop if this bothers you too much.
#To create the vector of average temperatures to loop over:

uniqAvgTemp=sort(unique(clean_data$avgTemp))

xRange=c(-30,110)

for (temp in uniqAvgTemp){

	minTemps=clean_data$TMIN[clean_data$avgTemp==temp]

	maxTemps=clean_data$TMAX[clean_data$avgTemp==temp]
freq1=hist(minTemps,plot=F,breaks=10)
freq2=hist(maxTemps,plot=F,breaks=10)
plot(freq1,col=rgb(0,0,1,1/4),xlim=c(xRange[1],xRange[2]),main=paste('Histogram of Max and Min Temperatures \n Avgerage Temperature ',toString(temp),' (n=',toString(length(minTemps)),')',sep=''))
abline(v=temp)
plot(freq2,col=rgb(1,0,0,1/4),xlim=c(xRange[1],xRange[2]),add=T)
Sys.sleep(1.5)
}
You can decrease the time between average temperature plots by changing Sys.sleep(1.5) to Sys.sleep(1.0) . Be careful going any lower if you are seizure sensitive and are working on a slow or remote computer. If you look closely at the code you will see I have plot() and then plot(,add=T) and it just combines the plots together like magic. When I first saw this I expected it to work every time when combining plots, but it doesn’t Stack Overflow: Why add=T does not work all the time.
But let’s figure out how to create GIF animations rather than deal with the graph window drawing each and every plot.
First install the R animation package.
install.packages('animation')
Then:
require(animation)

uniqAvgTemp=sort(unique(clean_data$avgTemp))

xRange=c(-30,110)

saveGIF({

	for (temp in uniqAvgTemp){

		minTemps=clean_data$TMIN[clean_data$avgTemp==temp]

		maxTemps=clean_data$TMAX[clean_data$avgTemp==temp]
freq1=hist(minTemps,plot=F,breaks=10)
freq2=hist(maxTemps,plot=F,breaks=10)
plot(freq1,col=rgb(0,0,1,1/4),xlim=c(xRange[1],xRange[2]),main=paste('Histogram of Max and Min Temperatures \n Avgerage Temperature ',toString(temp),' (n=',toString(length(minTemps)),')',sep=''))
abline(v=temp,lwd=3)
plot(freq2,col=rgb(1,0,0,1/4),xlim=c(xRange[1],xRange[2]),add=T)
}
},movie.name = "daily_avg_temp.gif",interval=0.5)
If the graph gets outputted correctly ani.options("convert") should not return NULL.
Here is what the GIF looks like. At low sample volumes (n<10) the bar widths get messed up but it looks pretty good once it gets going.
I realized after posting this that the x axis label is not correct it, should just be xlab='daily temperatures' in the first plot call.