
Problem 1
Our first task in problem 1 was to use the finite difference method to create a population model. We were given 2 equations and simply had to rearrange Equation 2 and solve for one of the variables, N(t2). It ended up looking something like this: N(t2) = (t2-t1)((aN(t1)(1-N(t1)/K))+N(t1).
Next, we used the equation above and created a loop in Python from 1 to n. We use loops when we have code that we want to repeat a fixed amount of times. My fish population model started with 100 individuals at time = 0, had a rate constant of 0.1, and a carrying capacity of 2000. This can be seen by my code which I annotated:
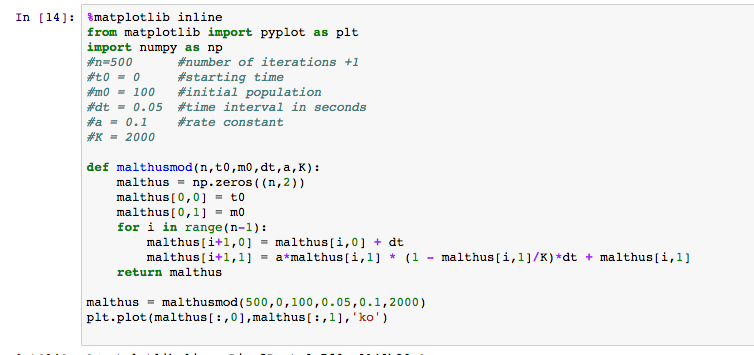
This is my code for problem 1 part 2. I named my function “malthusmod” and the values for my conditions may vary from other students.
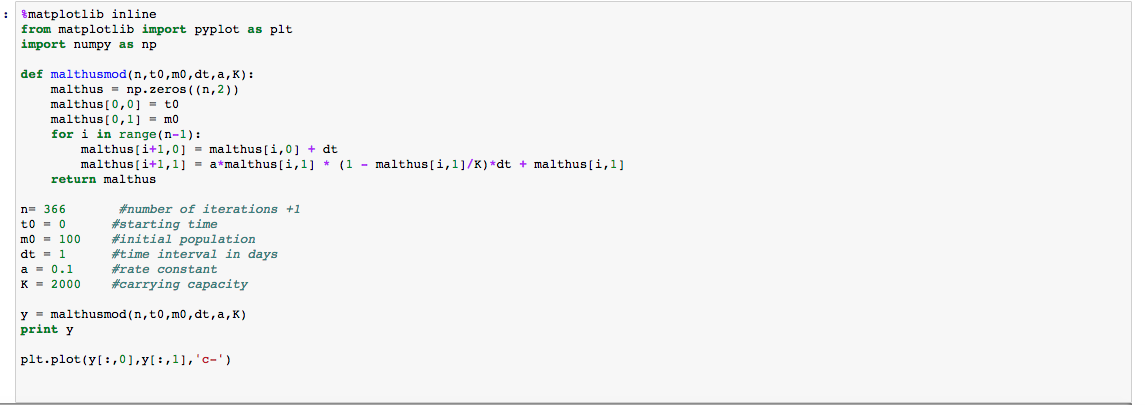
This is the output from my code. The x-axis indicates days, and the y-axis indicates individuals.
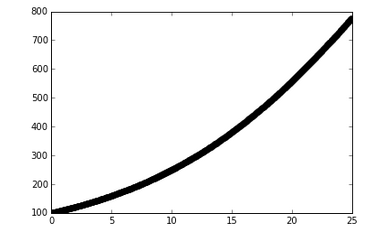
In part 3, I altered the code used above in order to find what day the population reaches 2000 individuals. As you can see, my last figure did not show that. My rate constant was changed to 0.1 with 365 iterations (since we wanted to iterate over one year). The carrying capacity appears to be reached at about 80 days.
For loop to provide us with when the population reaches the carrying capacity of 2000 individuals.
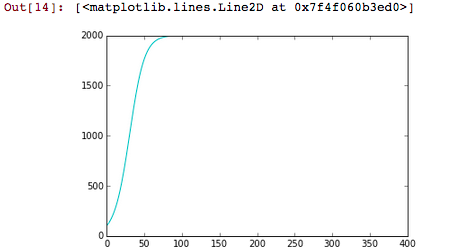
The output of the code above. As you can see, the population stops increasing as the maximum sustainable population is reached.
Problem 2
In this problem, we begin constructing our box model. This will allow us to look at the number of Coho fish in Lake Michigan throughout a specified time period, in this case, October to early December. For problem 1, we are given that 5.6 million Coho and Chinook are stocked each year. Coho represent 3/4 of this number. The time period that we are dealing with is 3 years, and we are asked for how many fish are stocked per day.
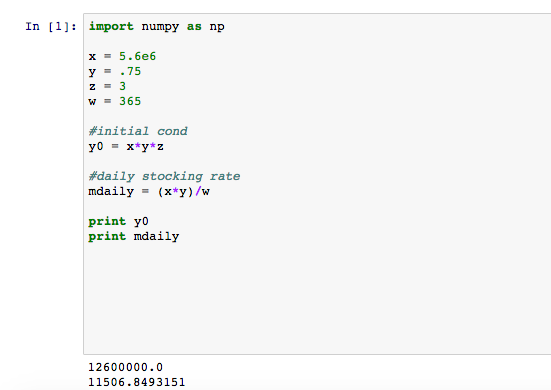
Using the conditions provided, the initial population of Coho and daily stocking rate were found.
In part 2, we are given that 1/3 of the fish population will be migrating during the selected time interval. We use a histogram to look at the amount of fish that leave each day for 60 days. The code and resulting figure are shown below:
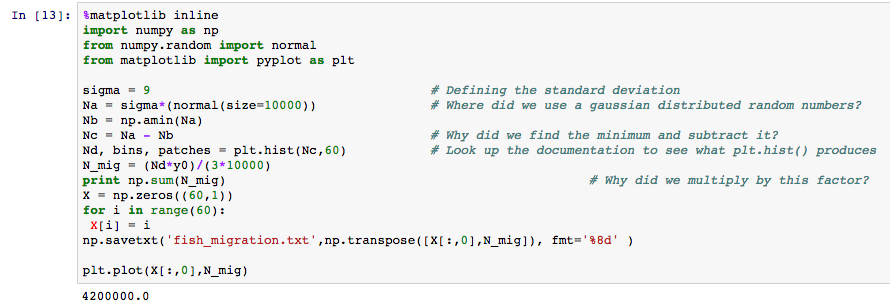
Code for problem 2 part 2. We were given much of this code and had to fill in some blanks. We also saved data in an external file named “fish_migration”.
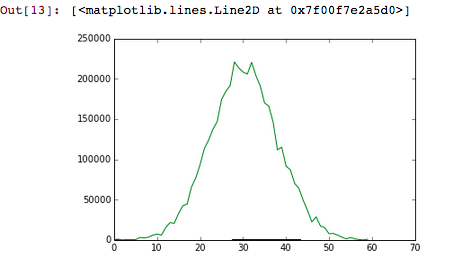
The resulting model from the code above. The x-axis represents days, and the y-axis represents individuals.
In part 3, we look at the death rate, which is dependent upon the number of fish in the lake. This can be shown by Equation 3, which was provided:
![]()
I defined my starting minimum rate as the daily stocking rate divided by the initial fish population in Lake Michigan (wmin). Wmin is density dependent upon the carrying capacity.
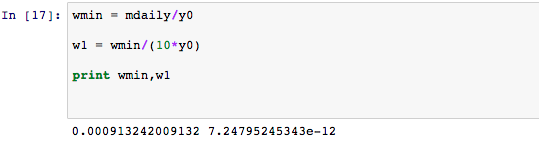
Death rate equations
In part 4, we looked at our model over a 30-day time span. The work up to this point was necessary to get to this step.
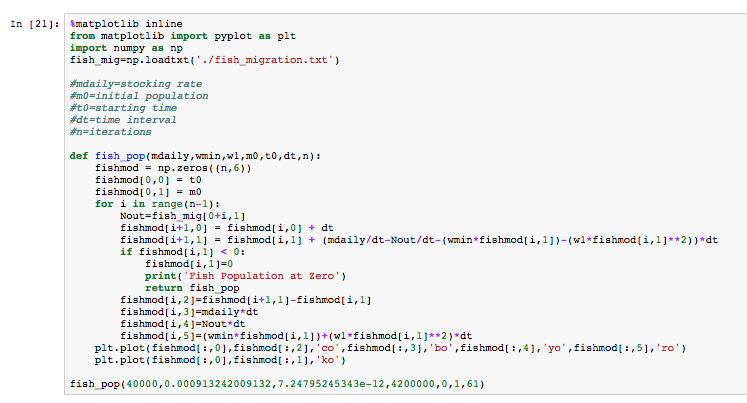
The finite difference approximation
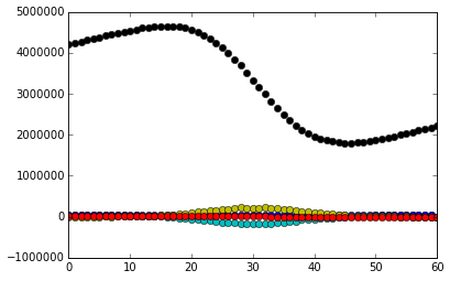
The actual model produced by the code above