Because of this, it often feels as if I am teaching students what to think, not how to think.
This really bothers me.
I do not want to teach students what to think. I want to teach them how to think.
I often consider how to present topics in ways that look at them from a bigger perspective, a top-down perspective, if you will. I like to do this first, then to fill in the details after looking at the big picture. I liken it to taking students up in an airplane and looking at the landscape from 30,000 feet first, and then going back down to earth examine the details of that landscape.
Maybe it’s just me and the way I think, the way I operate, the way life works for me. I am not sure but it works for me.
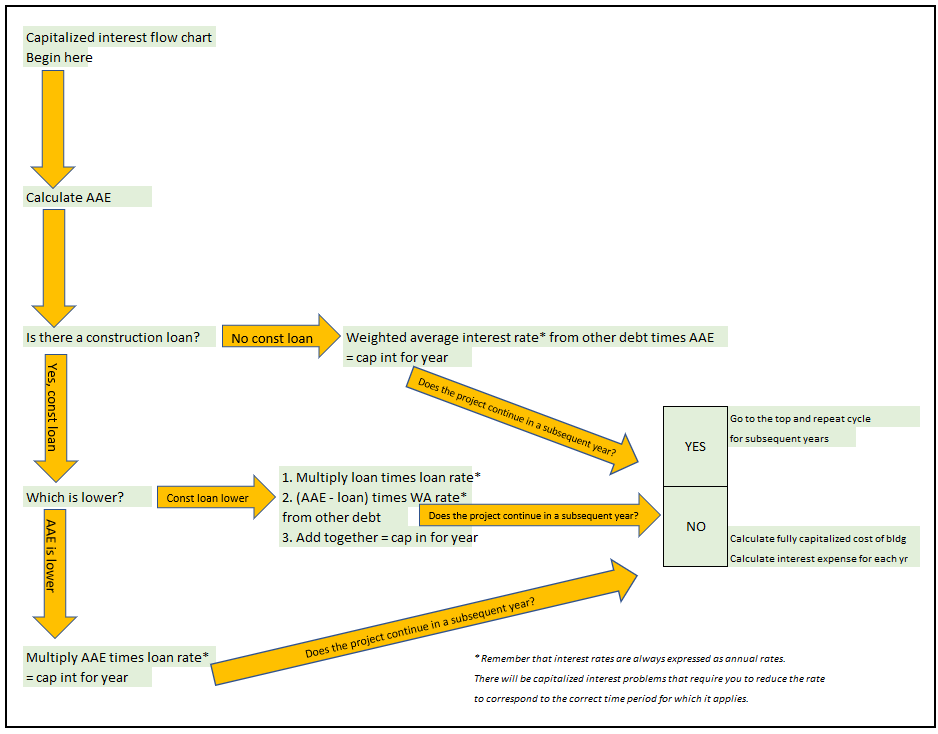
With this in mind, I’d like to show you the capitalized interest flow chart I created. It corresponds to Chapter 10 of the Intermediate Accounting textbook we use.
Studying how to capitalize interest for self-constructed assets seems really confusing and complicated at first. In case it’s not clear what I mean by “self-constructed asset,” a firm might construct a building for itself. It does not plan to sell the building, and it is not creating the building for another entity. It will occupy the building once the project is finished. The costs for the project are added to an asset account called Construction in progress (often abbreviated CIP). The capitalized interest is also added to the CIP account, raising the asset’s value on the balance sheet.
There are a lot of steps to the process of calculating capitalized interest, especially when the project continues into subsequent years. We have to calculate the average accumulated expenditures (AAE), the weighted average interest of other debt held, the fully capitalized cost of the asset, the interest expense, etc. The various calculations can seem intimidating, especially for the AAE, since accounting problems will always incorporate time periods of less than 12 months for some portion of the project just to force students to read the details carefully. Often the denominator is 12 when calculating the AAE, but sometimes it is not!
These details, and more that I have not included here, can seem overwhelming at first since they are not presented in a clear, visual context. We’re just hacking through the brush without really understanding where we are or where we are going. I created this flow chart to provide a visual orientation for the process… to take us in an airplane so we can survey the landscape first before we start hacking. I believe this makes the process less intimidating.
If you teach this material, let me know what you think of this diagram. You can download the PDF version here: https://uofi.box.com/s/f2vc2o2nj8jotgzbihmvji9m9zaabiug