
Broad Band Sum Frequency Generation (BBSFG) spectroscopy
Sum frequency generation (SFG) spectroscopy is a nonlinear optical sp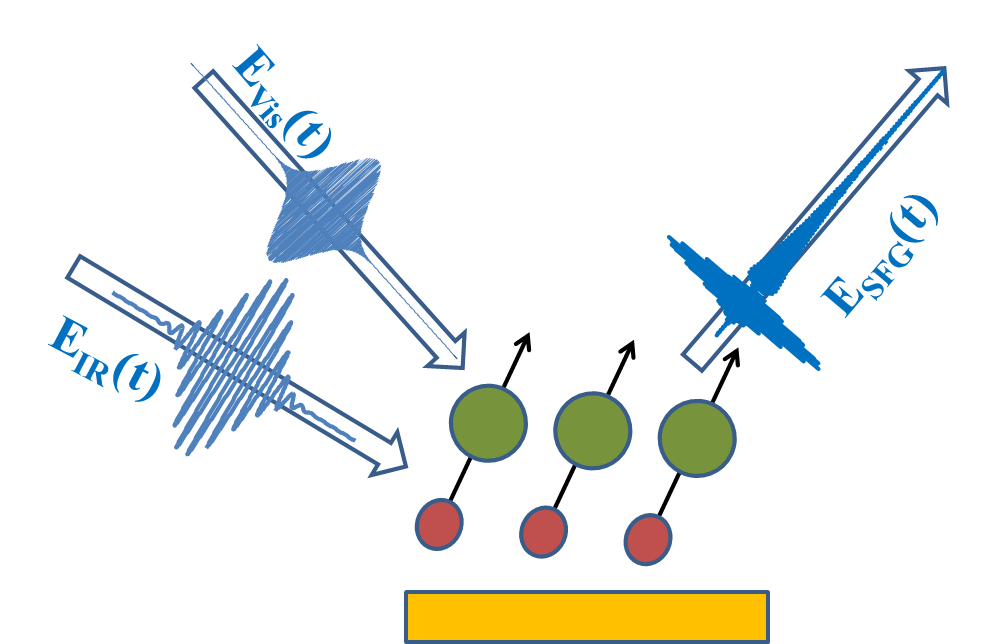 ectroscopic technique where a sum frequency photon is detected when two photons of different frequencies are overlapped in time and space on a sample. The SFG intensity is a measure of the second-order susceptibility (χ(2)) of the sample. In the dipole approximation χ(2) vanishes in centrosymmetric media: the bulk of the sample. However, surfaces and interfaces break the symmetry and are SFG active. Thus SFG spectroscopy is sensitive and selective to the species present at the surfaces/interfaces.
The adjacent figure shows the incidence of a visible (EVis) and and IR (EIR) pulse on the sample to generate a SFG response (ESFG) in the reflection geometry. The molecular vibration probed by the SFG is shown in red and green with the dipole moment shown with the arrows. In our experiments we use vibrational SFG as a probe to detect molecular vibrations of chemical species at the interfaces. With a broad band tunable IR laser source we are able excite the vibrations of the adsorbed surface species. The IR response (also known as the free induction decay) is then up-converted to the sum frequency by overlapping with a time-delayed narrow band visible beam.
Non Resonant suppressed Sum Frequency Generation spectroscopy
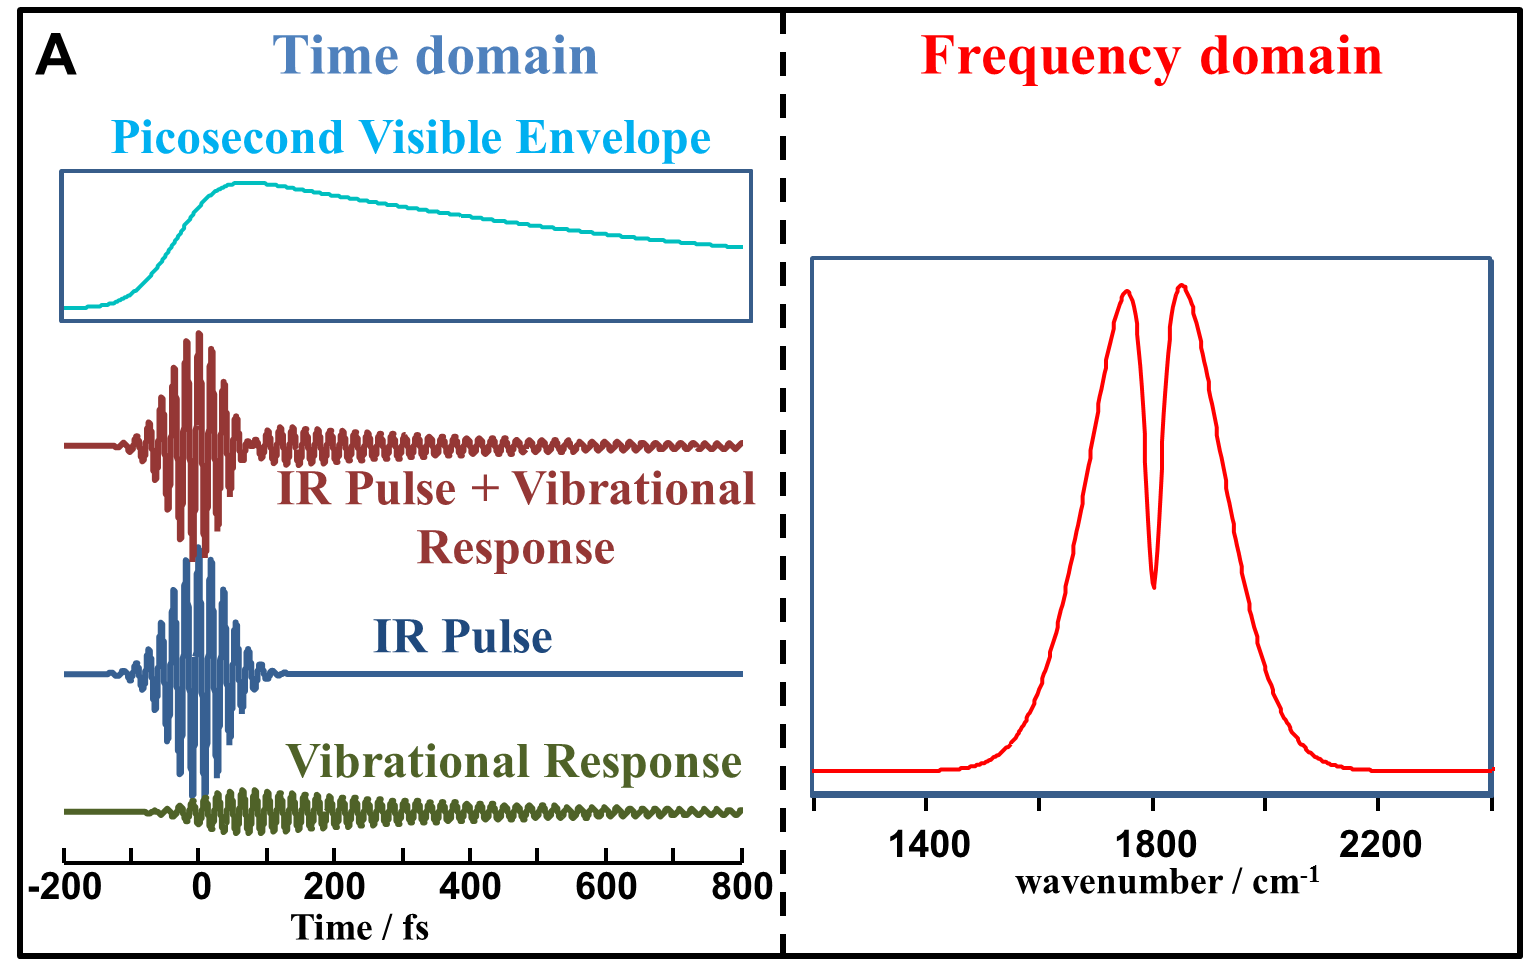
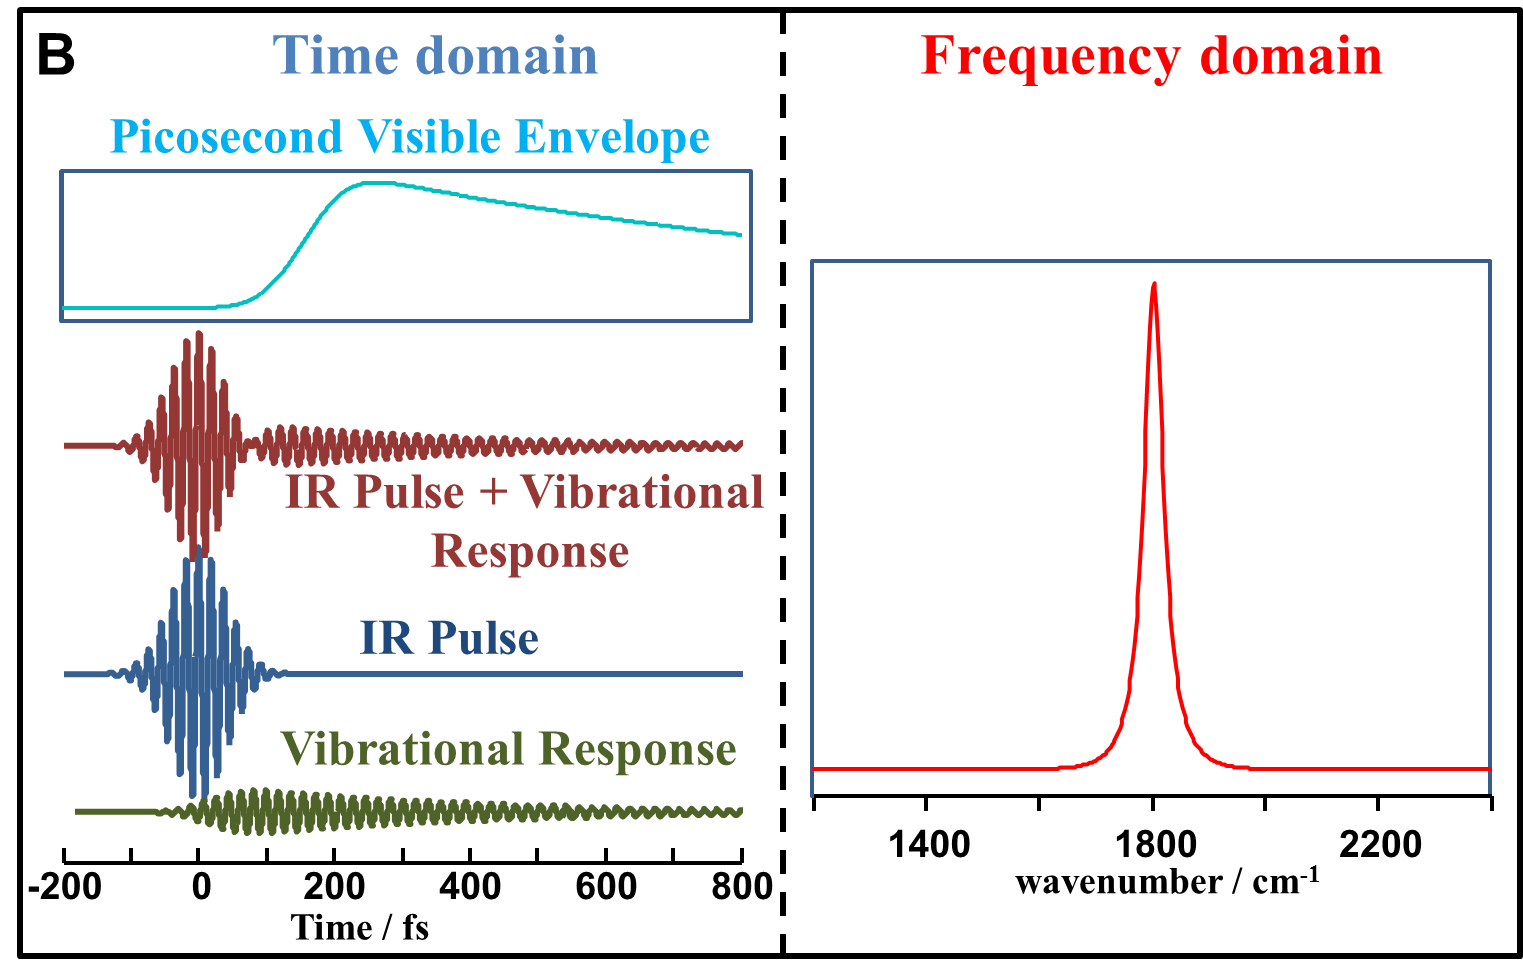
In our experiments we use non resonant suppressed SFG technique. Nonresonant (NR) suppression is better understood in the time domain. The following figure correlates between the time domain and the frequency domain NR SFG spectrosocpy. A femtosecond IR pulse excites the vibrational modes in a molecule that generates a free induction decay (FID) also known as the vibrational response. A picosecond visible pulse, when overlapped in time with the IR (fig. A) generates an instantaneous or a non resonant response (simlar to the IR field). In the frequency domain (fig. A) the broad lineshape results from the Fourier transform of the IR field, whereas the dip results from the vibrational FID. In Fig. B when the visible pulse is time delayed from the IR pulse, only the vibrational response is detected as a peak in Fig. B. as the non resonance is suppressed.
Our lab first demonstrated the non resonance suppression technique in the following article. It is an elegant technique to detect molecular vibrations and hence molecules at the surface/interface. A lot of our research entails electrochemistry as we are interested in the chemistries at the electrode surfaces. These chemistries may involve the oxidation/reduction of the electrolyte on the electrode surface or formation of a passive layer on the surface. Thus we have devised an opto-electrochemical cell that is capable of regulating the potential of an electrode and simultaneously acquire SFG spectra. Details of the BBSFG technique and the opto-electrochemical cell are discussed in the following article.
Lagutchev A., Lozano A., Mukherjee P., Hambir S. A., Dlott D. D., “Compact broadband vibrational sum-frequency generation spectrometer with nonresonant suppression.”, Spectrochimica acta. Part A, Molecular and biomolecular spectroscopy, 75, 1289, 2010.
Opto-electrochemistry
 Opto-elechemistry is not unique in the electrochemistry communtiy as there are numerous instances of Raman and infrared spectra of electrode surfaces as a function of potential. But Raman and infrared spectroscopies are insensitive to the surface species. So it is impossible to predict molecular dyanmics on electrode surfaces with these techniques.
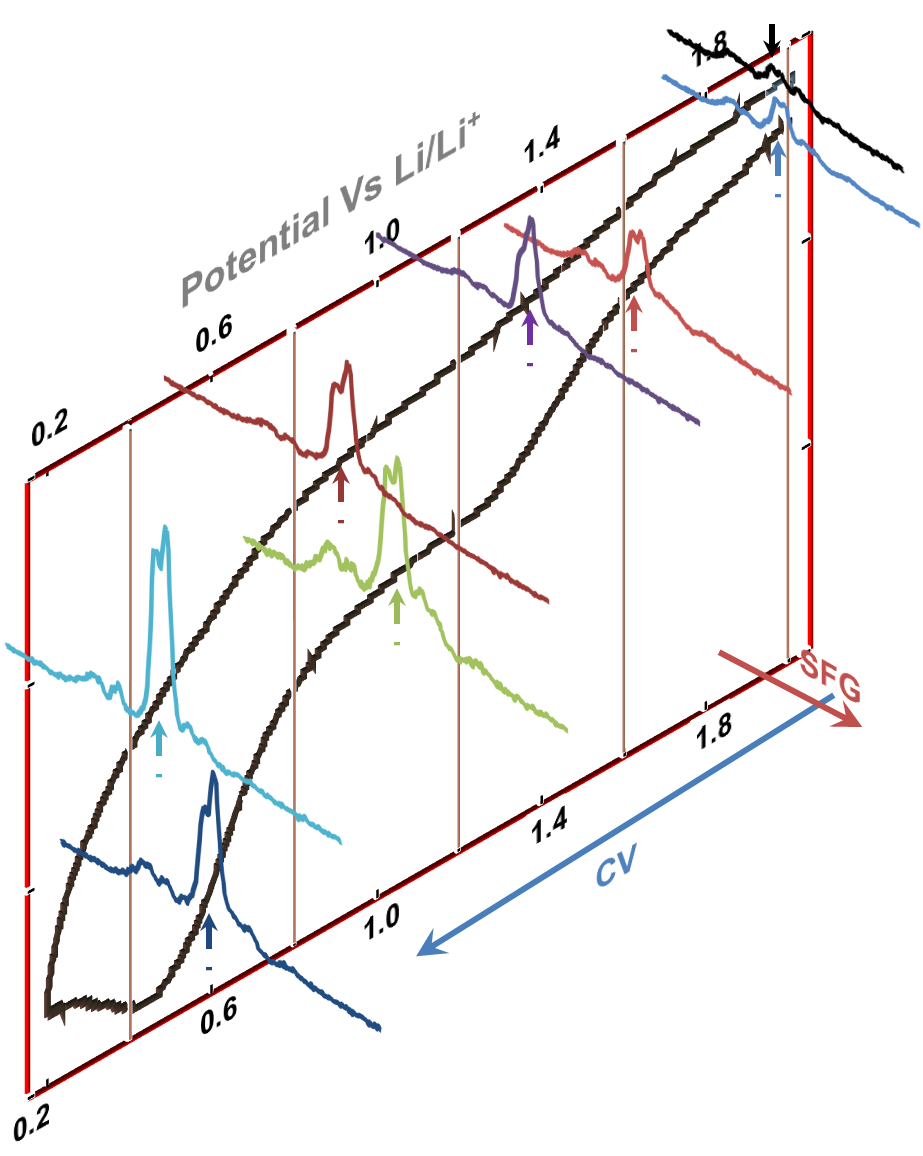
Our ability to acquire SFG spectra under potential conditions gives us the edge over the existing techniques. The adjacent figure shows a representative dataset we generate in our laboratory. We see a cyclic voltammogram (CV) in one dimension with the potential axis labeled. Perpendicular to the potential axis is the frequency axis of our spectra (not labeled). With our ability to synchronize SFG acquisition to potential change, we can obtain spectra at selected potential ranges in the CV.
Our ability to acquire SFG spectra under potential conditions gives us the edge over the existing techniques. The adjacent figure shows a representative dataset we generate in our laboratory. We see a cyclic voltammogram (CV) in one dimension with the potential axis labeled. Perpendicular to the potential axis is the frequency axis of our spectra (not labeled). With our ability to synchronize SFG acquisition to potential change, we can obtain spectra at selected potential ranges in the CV.
We combine the non-resonance suppression technique with the electrochemical methods to study various systems such as “Solid Electrolyte Interphases” in Lithium ion batteries, or fuel cell oxidations on electrode surfaces or Carbon dioxide reduction at low overpotentials. These are briefly discussed in the research topics section.