By Savannah Adams, Conservation Unit Graduate Assistant
“The Conservation Professional shall document examination, scientific investigation and treatment by creating permanent records and reports”
Article VII, AIC’s Code of Ethics
Everyone loves a satisfying before and after picture, but for conservators those photos are also an important record of how an item has changed during treatment. In fact, those photos are so important that the Conservation Unit has a whole area dedicated to image capture. This summer, the Conservation Unit had the opportunity to refresh our photo documentation area. The space now features a new grey paper backdrop, more storage, and most importantly, new LED lights!
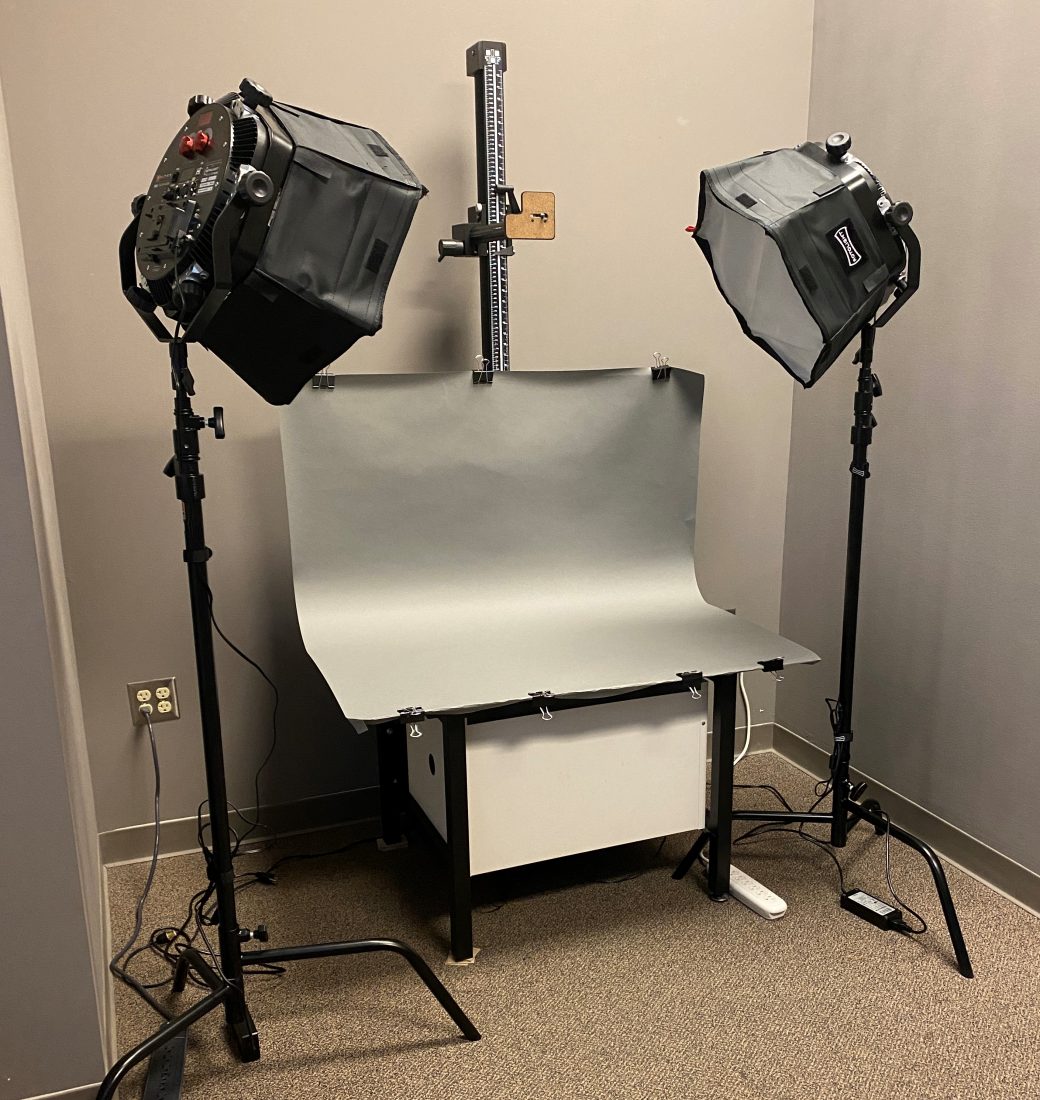
Until recently, our copy stand (Fig. 1) was equipped with four flood lamps using 250W incandescent bulbs. Although the specifications for these lights weren’t terrible – emitting 6500 lumens and a Color Temperature (CT) of 3500K – the bulbs burned uncomfortably hot and had an average lifespan of about 3 hours. With a library collection as large as the U of I’s, we were burning through a lot of bulbs during photo documentation of the library’s special collection materials.
Working as the Conservation lab’s Photo Documentation Coordinator, I wanted to find a new sustainable light source that would burn cooler and longer than incandescent. I also wanted to better understand how different light sources might affect the type of photography we use for conservation documentation. After months of researching light bulbs, light terminology, referencing the AIC standards for conservation photo documentation, and asking our friends in Digitization Services for guidance, we made the leap and updated our setup with two new LED Studio lights. And what a difference it’s made!
Conservation Photo Documentation
Before delving into the nitty-gritty light bulb jargon, let’s discuss the function of Conservation photo documentation and how it differs from digitization and other forms of documentation.
The role of conservation photo documentation (here after referred to as photodoc) is to provide a visual representation of an object before, after, and sometimes during treatment procedures. Unlike digitization – which aims to create a digital reproduction or surrogate of an object – conservation photo documentation is intended to provide a photographic record of the conservation treatment that may be used to supplement both written documentation and treatment reports.
In addition to being used for before and after treatment comparison, photodoc can also serve as an examination tool, wherein the use of different light sources, directions, or wavelengths can highlight certain areas of damage or surface textures that may otherwise go unnoticed. Want to see how it works? Try crumpling up a sheet of scrap paper and then opening it flat(ish) again. Use a flashlight to illuminate the paper from above and note how it looks. Next, move the flashlight down so it sits on the same surface as the paper and illuminates it from one side. The peaks and valleys of the crumpled paper will look much more dramatic!
Therefore, it is important that each image consistently represents the scale, color, and texture of the object as accurately as possible – which is sometimes trickier than it sounds. One of the most important elements for achieving this level of image accuracy is lighting.
Lighting Specifications for Conservation Photo Documentation: LED vs Incandescent
Our newly acquired LED lights deliver up to 10,700 lux while only using 75 watts of power consumption (that’s 175W less than our previous bulbs!). In addition, the LEDs have a Color-Rendering Index (CRI) of >96, emit 5580 lumens, and a color temperature (CT) range of 3150-6300K. All these words and numbers may sound nonsensical to those uninitiated in light bulb technical specifications. However, when you break down the terminology and compare the different features of our old incandescent verses the new LEDs, you may find that the information is…illuminating.
According to the AIC Conservation Photography and Documentation Guide, the ideal light source should be, “continuous and inexpensive, with low heat output, a daylight color temperature, and a smooth and spike-free spectral curve” (section 2.3, p. 19). But what does that mean exactly? And how did our old incandescent lights fare verse our new LED lights? Is it even possible to achieve all these characteristics within a single light source? The short answer is no, but our new LEDs are a good step closer to the perfect bulb. Let’s deconstruct the AIC quote bit-by-bit in order to better understand what we want our lightbulb to do:
“…continuous and inexpensive…”
A continuous light source is one that is exactly that – the intensity of the light remains constant and flicker-free. The expense of a light depends on several factors, including frequency of use, heat offput, or current output. However, to demonstrate the amazing cost efficiency of LEDs over incandescent, we try and figure how much the light sources costs us for an hour of use:

One of our previous incandescent bulbs cost $5.99 with an approximate life expectancy of 3 hours. In contrast, one Anova Pro II LED light costs $1,477 and has an estimated lifespan of 100,000 hours. Therefore, it costs…
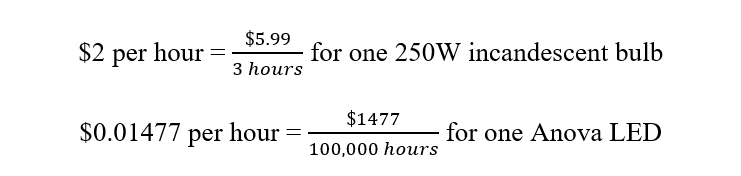
Thus, the LED light source is 120x cheaper than the incandescent alternative. Note that this does not take into consideration power demands of the bulbs and how much the electricity will cost to power them. It’s fairly well known that LEDs are the most cost-effective option, but we did the math on this too and you can expect to spend around 80% less on energy for LEDs vs incandescent providing the same amount of light.
“…low heat output…”
As the person working under them, I have always held that the heat output should be relatively high on the list of considerations for lights used for conservation photodoc purposes. Our old incandescent lights would quickly heat the photodoc area to an uncomfortable temperature! Even more importantly, subjecting library materials to direct, high temperature lighting can contribute to photocatalytic degradation and is therefore an key aspect to consider when looking into bulb types. For example, a 100-watt incandescent bulb has a filament temperature of approximately 4,600 degrees F and a surface temperature between 150-250 degrees F. In contrast, the Anova Pro II LED studio lights have an operating temperature of 5-100 degrees F (depending on brightness settings).
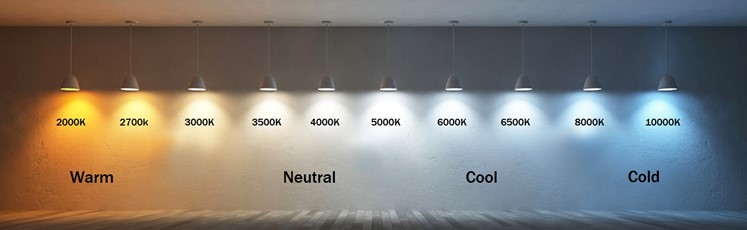
Fig 3: Range in Kelvin temperatures from 2000K – 10,000K
“…a daylight color temperature…”
Color Temperature (CT) is the color of the light emitted and is measured in Kelvins (K). For photo documentation purposes, a standard CT ranges from warm, reddish tungsten (3200K) to a cool, bluish (8000K). As mentioned above, the ideal CT for conservation photodoc is a daylight color temperature which is around 5500K.
Additional information regarding color is attributed to its CRI or “Color-Rendering Index.” The CRI is measured in a scale of 0-100 and describes how well a light source reproduces a set of different colors in comparison to a reference light source of the same or similar color temperature. Under this system, the highest possible CRI is 100 – the ideal for photo documentation purposes. Our previously used incandescent bulbs had a fixed CT of 3500K and a CRI between 80-90, while the LEDs have an adjustable CT of 3150K-6300K and a CRI of >96.
“…and a smooth, spike-free spectral curve…”
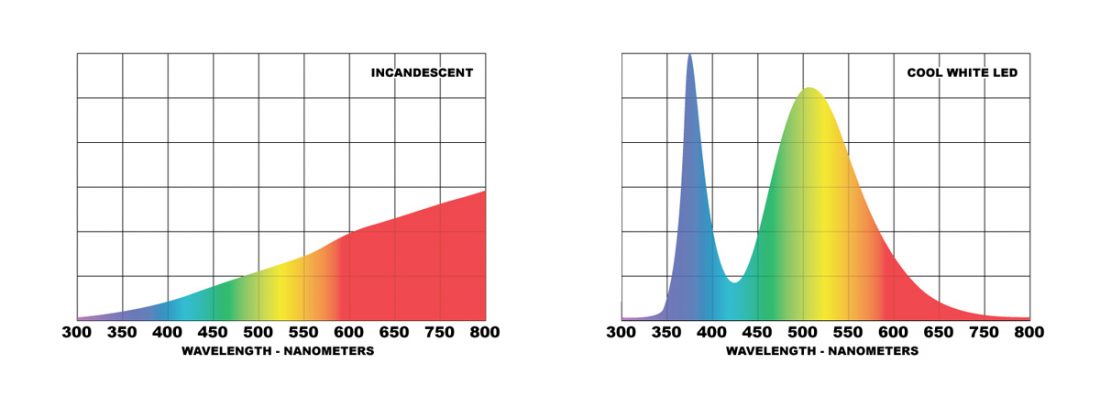
Different light sources emit various intensities of light at different colors across the spectrum. The emitted lights can be visualized in a type of graph called a spectral curve, where the x-axis represents intensity and the y-axis represents wavelengths of light in the visible range. To achieve a “smooth” and “spike-free” curve, the light source should exhibit a smooth arc that is well distributed across the color spectrum. In the image below, the spectral curves of incandescent and LEDs are compared. Visually, the incandescent lights (left) appear smooth while the LEDs (right) exhibit two spikey arcs. However, because the incandescent emits far less blue light, they are more challenging to accurately color match. Although LEDs may appear more “spikey,” both light sources are considered smooth (for example, compare the spectral curve of fluorescent lights – yikes!). As seen below, LEDs actually provide a more balanced distribution of colors across the color spectrum, giving them the advantage.
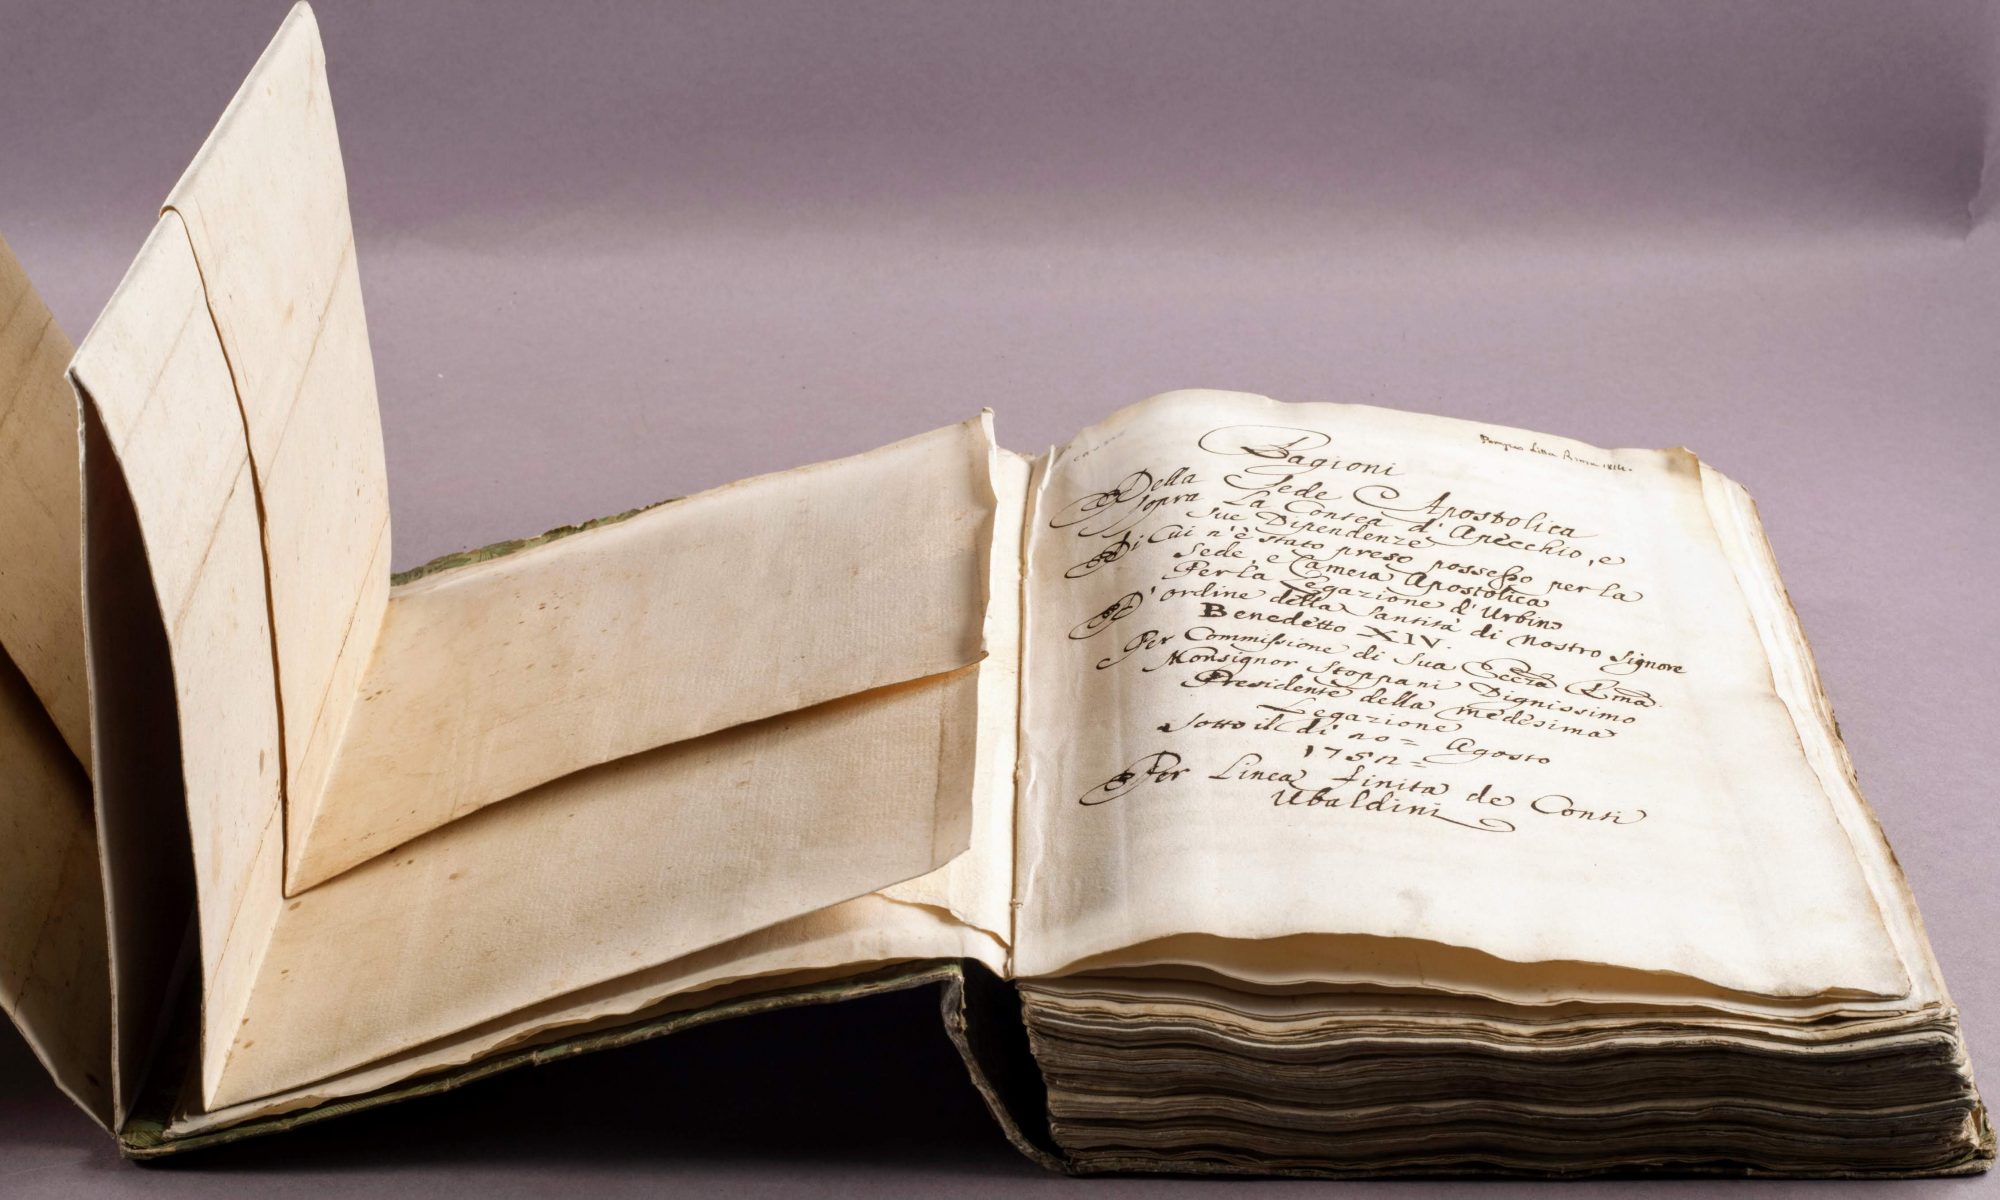
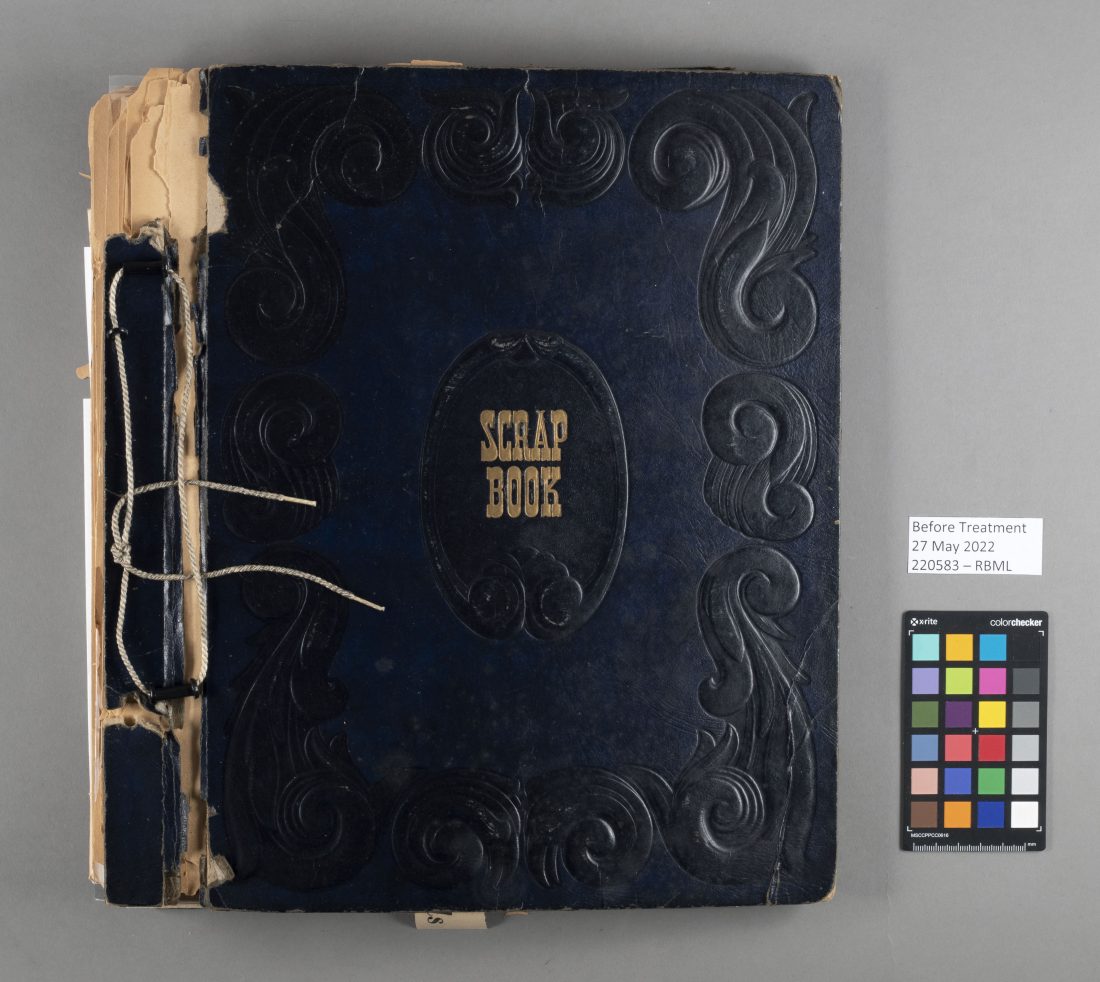
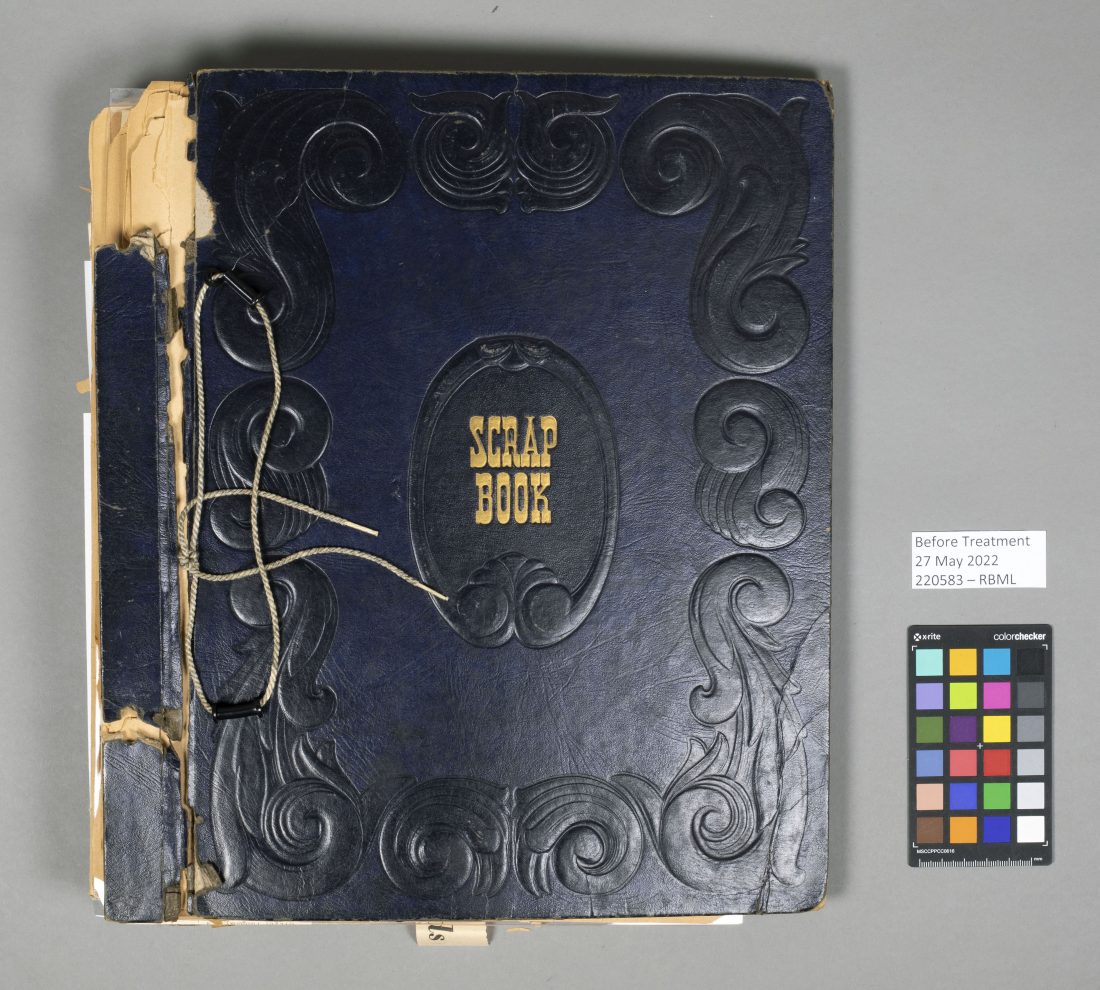
So, after weighing the pros and cons, the decision to trade out our old incandescent lights for new LEDs was a no brainer. The photographs speak for themselves! See above (Fig 2) for a comparison of the same “black” scrapbook photographed under incandescent verses LEDs. Due to the brighter and more evenly distributed light from the LEDs, it was revealed that the book wasn’t black, but blue!
References:
https://www.pacificlamp.com/temperature-of-a-100-watt-bulb.asp
https://karltayloreducation.com/lighting-angles-reflection-photography/
https://www.library.illinois.edu/preservation/
https://www.ledlightingwholesaleinc.com/Understanding-Lumens-vs-Kelvin-s/399.htm