Digital Humanities Maps

Historically, maps were 2D, printed, sometimes wildly inaccurate representations of space. Today, maps can still be wildly inaccurate, but digital tools provide a way to apply more data to a spatial representation. However, displaying data on a map is not a completely new idea. W.E.B. DuBois’ 1899 sociological research study “The Philadelphia Negro” was one of the first to present data in a visual format, both in map form and other forms.

map of the seventh ward of philadelphia, each household is drawn on the map and represented by a color corresponding to class standing

The colors on the map indicate the class standing of each household.

Digital maps can add an interesting, spatial dimension to your humanities or social science research. People respond well to visuals, and maps provide a way to display a visual that corresponds to real-life space. Today we’ll highlight some DH mapping projects, and point to some resources to create your own map!

(If you are interested in DH maps, attend our Mapping in the Humanities workshop next week!)

Sources of Digital Maps

Some sources of historical maps, like the ones below, openly provide access to georeferenced maps. “Georeferencing,” also called “georectifying,” is the process of aligning historical maps to precisely match a modern-day map. Completing this process allows historical maps to be used in digital tools, like GIS software. Think of it like taking an image of a map, and assigning latitude/longitude pairs to different points on the map that correspond to modern maps. Currently, manually matching the points up is the only way to do this!

A map from a book about Chicago placed over a modern map of Chicago.

A map of Chicago from 1891 overlaid on a modern map of the Chicago area.

David Rumsey Map Collection
The David Rumsey Map Collection is a mainstay in the world of historical maps. As of the time of writing, 68% of their total map collection has been georeferenced. There are other ways to interact with the collection, such as searching on a map for specific locations, or even viewing the maps in Second Life!

NYPL Map Warper
The New York Public Library’s Map Warper offers a large collection of historical maps georeferenced by users. Most maps have been georeferenced at this point, but users can still help out!

OpenStreetMap
OpenStreetMap is the open-source, non-proprietary version of Google Maps. Many tools used in DH, like Leaflet and Omeka’s Neatline, use OpenStreetMap’s data and applications to create maps.

Digital Mapping Humanities Projects

Get inspired! Here are some DH mapping projects to help you think about applying mapping to your own research.

Maps provide the perfect medium for DH projects focused on social justice and decolonization. Native-land.ca is a fairly recent example of this application. The project, started as a non-academic, private project in 2015, has now transformed into a not-for-profit organization. Native-land.ca attempts to visualize land belonging to native nations in the Americas and Australia, but notably not following the official or legal boundaries. The project also provides a teacher’s guide to assist developing a curriculum around colonization in schools.

map of florida with data overlay indicating which native tribes have rights to the land

The state of Florida occupies the territory of multiple native tribes, notably those of the Seminole.

Other projects use digital tools that show a map in conjunction with another storytelling tool, like a timeline or a narrative. The levantCarta/Beirut project uses a timeline to filter which images show up on the connected map of Beirut. We can easily see the spatial representation of a place in a temporal context. A fairly easy tool for this kind of digital storytelling is TimeMapper.

For a more meta example, check out this map of digital humanities labs by Urszula Pawlicka-Deger. Of course these DH centers do projects other than mapping, but even the study of DH can make use of digital mapping!

If you’re interested in adding maps to your humanities research, check out our workshop this semester on humanities mapping. There are also great tutorials for more advanced mapping on The Programming Historian.

And as always, feel free to reach out to the Scholarly Commons (sc@library.illinois.edu) to get started on your digital humanities project.

Transformation in Digital Humanities

The opinions presented in this piece are solely the author’s and referenced authors. This is meant to serve as a synthesis of arguments made in DH regarding transformation.

How do data and algorithms affect our lives? How does technology affect our humanity? Scholars and researchers in the digital humanities (DH) ask questions about how we can use DH to enact social change by making observations of the world around us. This kind of work is often called “transformative DH.”

The idea of transformative DH is an ongoing conversation. As Moya Bailey wrote in 2011, scholars’ experiences and identities affect and inform their theories and practices, which allows them to make worthwhile observations in diverse areas of humanities scholarship. Just as there is strong conflict about how DH itself is defined, there is also conflict regarding whether or not DH needs to be “transformed.” The theme of the 2011 Annual DH Conference held at Stanford was “Big Tent Digital Humanities,” a phrase symbolizing the welcoming nature of the DH field as a space for interdisciplinary scholarship. Still, those on the fringes found themselves unwelcome, or at least unacknowledged.

This conversation around what DH is and what it could be exploded at the Modern Languages Association (MLA) Convention in 2011, which featured multiple digital humanities and digital pedagogy sessions aimed at defining the field and what “counts” as DH. During the convention Stephen Ramsay, in a talk boldly title “Who’s In and Who’s Out,” stated that all digital humanists must code in order to be considered a digital humanist (he later softened “code” to “build”). These comments resulted in ongoing conversations online about gatekeeping in DH, which refer to both what work counts as DH and who counts as a DHer or digital humanist. Moya Bailey also noted certain that scholars whose work focused on race, gender, or queerness and relationships with technology were “doing intersectional digital humanities work in all but name.” This work, however, was not acknowledged as digital humanities.

logo

Website Banner from transformdh.org

To address gatekeeping in the DH community more fully, the group #transformDH was formed in 2011, during this intense period of conversation and attempts at defining. The group self-describes as an “academic guerrilla movement” aimed at re-defining DH as a tool for transformative, social justice scholarship. Their primary objective is to create space in the DH world for projects that push beyond traditional humanities research with digital tools. To achieve this, they encourage and create projects that have the ability to enact social change and bring conversations on race, gender, sexuality, and class into both the academy and the public consciousness. An excellent example of this ideology is the Torn Apart/Separados project, a rapid response DH project completed in response to the United States enacting a “Zero Tolerance Policy” for immigrants attempting to cross the US/Mexico border. In order to visualize the reach and resources of ICE (those enforcing this policy), a cohort of scholars, programmers, and data scientists banded together and published this project in a matter of weeks. Projects such as these demonstrate the potential of DH as a tool for transformative scholarship and to enact social change. The potential becomes dangerously disregarded when we set limits on who counts as a digital humanist and what counts as digital humanities work.

For further, in-depth reading on this topic, check out the articles below.

Cool Text Data – Music, Law, and News!

Computational text analysis can be done in virtually any field, from biology to literature. You may use topic modeling to determine which areas are the most heavily researched in your field, or attempt to determine the author of an orphan work. Where can you find text to analyze? So many places! Read on for sources to find unique text content.

Woman with microphone

Genius – the song lyrics database

Genius started as Rap Genius, a site where rap fans could gather to annotate and analyze rap lyrics. It expanded to include other genres in 2014, and now manages a massive database covering Ariana Grande to Fleetwood Mac, and includes both lyrics and fan-submitted annotations. All of this text can be downloaded and analyzed using the Genius API. Using Genius and a text mining method, you could see how themes present in popular music changed over recent years, or understand a particular artist’s creative process.

homepage of case.law, with Ohio highlighted, 147,692 unique cases. 31 reporters. 713,568 pages scanned.

Homepage of case.law

Case.law – the case law database

The Caselaw Access Project (CAP) is a fairly recent project that is still ongoing, and publishes machine-readable text digitized from over 40,000 bound volumes of case law from the Harvard Law School Library. The earliest case is from 1658, with the most recent cases from June 2018. An API and bulk data downloads make it easy to get this text data. What can you do with huge amounts of case law? Well, for starters, you can generate a unique case law limerick:

Wheeler, and Martin McCoy.
Plaintiff moved to Illinois.
A drug represents.
Pretrial events.
Rocky was just the decoy.

Check out the rest of their gallery for more project ideas.

Newspapers and More

There are many places you can get text from digitized newspapers, both recent and historical. Some newspaper are hundreds of years old, so there can be problems with the OCR (Optical Character Recognition) that will make it difficult to get accurate results from your text analysis. Making newspaper text machine readable requires special attention, since they are printed on thin paper and have possibly been stacked up in a dusty closet for 60 years! See OCR considerations here, but the newspaper text described here is already machine-readable and ready for text mining. However, with any text mining project, you must pay close attention to the quality of your text.

The Chronicling America project sponsored by the Library of Congress contains digital copies of newspapers with machine-readable text from all over the United States and its territories, from 1690 to today. Using newspaper text data, you can analyze how topics discussed in newspapers change over time, among other things.

newspapers being printed quickly on a rolling press

Looking for newspapers from a different region? The library has contracts with several vendors to conduct text mining, including Gale and ProQuest. Both provide newspaper text suitable for text mining, from The Daily Mail of London (Gale), to the Chinese Newspapers Collection (ProQuest). The way you access the text data itself will differ between the two vendors, and the library will certainly help you navigate the collections. See the Finding Text Data library guide for more information.

The sources mentioned above are just highlights of our text data collection! The Illinois community has access to a huge amount of text, including newspapers and primary sources, but also research articles and books! Check out the Finding Text Data library guide for a more complete list of sources. And, when you’re ready to start your text mining project, contact the Scholarly Commons (sc@library.illinois.edu), and let us help you get started!

HathiTrust Research Center Expands Text Mining Corpus

Good news for text and data mining researchers! After years of court cases and policymaking, the entire 16-million-item collection of the HathiTrust Digital Library, including content in-copyright, is available for text and data mining. (Yay!)

Previously, only non-copyrighted, public domain materials were able to be used with HTRC Analytics’ suite of tools. The restriction obviously limited ability to do quality computational research on modern history; most out-of-copyright items are texts created before 1923. With this update, everyone can perform text analysis on the full corpus with different tools. HathiTrust is membership-based, so some restrictions apply to non-member institutions and independent scholars alike (Illinois is a member institution). With the passage of this new policy, only one service, the HTRC Data Capsule (a virtual computing environment), retains members-only access to the full corpus for requesters with an established research need. There are over 140 member institutions, including University of Illinois.

Here’s a quick overview of HTRC’s tools and access permissions (from HTRC’s Documentation).

  • HTRC Algorithms: a set of tools for assembling collections of digitized text from the HathiTrust corpus and performing text analysis on them. Including copyrighted items for ALL USERS.
  • Extracted Features Dataset: dataset allowing non-consumptive analysis on specific features extracted from the full text of the HathiTrust corpus. Including copyrighted items for ALL USERS.
  • HathiTrust+Bookworm: a tool for visualizing and analyzing word usage trends in the HathiTrust corpus. Including copyrighted items for ALL USERS.
  • HTRC Data Capsule: a secure computing environment for researcher-driven text analysis on the HathiTrust corpus. All users may access public domain items. Access to copyrighted items is available ONLY to member-affiliated researchers.

Fair Use to the Rescue!

How is this possible? Through both the Fair Use section of the Copyright Act and HathiTrust’s policy of allowing only non-consumptive research. Fair Use protects use of copyrighted materials for educational, research, and transformative purposes. Non-consumptive research means that researchers can glean information about works without actually being able to read (consume) them. You can see the end result (topic models, word and phrase statistics, etc.), without seeing the entirety of the work for human reading. Allowing computational research only on a corpus protects rights holders, and benefits researchers. A researcher can perform text analysis on thousands of texts without reading them all, which is the basis of computational text analysis anyway! Our Copyright Librarian, Sara Benson, recently discussed how Fair Use factors into HathiTrust’s definition of non-consumptive research.

Ready to use HTRC Analytics for text mining? Check out their Getting Started with HTRC Guide for some simple, guided start-up activities.

For general information about the digital library, see our guide on HathiTrust.

Analyze and Visualize Your Humanities Data with Palladio

How do you make sense of hundreds of years of handwritten scholarly correspondence? Humanists at Stanford University had the same question, and developed the project Mapping the Republic of Letters to answer it. The project maps scholarly social networks in a time when exchanging ideas meant waiting months for a letter to arrive from across the Atlantic, not mere seconds for a tweet to show up in your feed. The tools used in this project inspired the Humanities + Design lab at Stanford University to create a set of free tools specifically designed for historical data, which can be multi-dimensional and not suitable for analysis with statistical software. Enter Palladio!

To start mapping connections in Palladio, you first need some structured, tabular data. An Excel spreadsheet in CSV format with data that is categorized and sorted is sufficient. Once you have your data, just upload it and get analyzing. Palladio likes data about two types of things: people and places. The sample data Palladio provides is information about influential people who visited or were otherwise connected with the itty bitty country of Monaco. Read on for some cool things you can do with historical data.

Mapping

Use the Map feature to mark coordinates and connections between them. Using the sample data that HD Lab provided, I created the map below, which shows birthplaces and arrival points. Hovering over the connection shows you the direction of the move. By default, you can change the map itself to be standard maps like satellite or terrain, or even just land masses with no human-created geography, like roads or place names.

Map of Mediterranean sea and surrounding lands of Europe, red lines across map show movement, all end in Monaco

One person in our dataset was born in Galicia, and later arrived in Monaco.

But, what if you want to combine this new-fangled spatial analysis with something actually historic? You’re in luck! Palladio allows you to use other maps as bases, provided that the map has been georeferenced (assigned coordinates based on locations represented on the image). The New York Public Library’s Map Warper is a collection of some georeferenced maps. Now you can show movement on a map that’s actually from the time period you’re studying!

Same red lines across map as above, but image of map itself is a historical map

The same birthplace to arrival point data, but now with an older map!

Network Graphs

Perhaps the connections you want to see don’t make sense to be on a map, like those between people. This is where the Graph feature comes in. Graph allows you to create network visualizations based on different facets of your data. In general, network graphs display relationships between entities, and work best if all your nodes (dots) are the same type of information. They are especially useful to show connections between people, but our sample data doesn’t have that information. Instead, we can visualize our peoples’ occupation by gender.

network graph shows connections between peoples' occupations and their gender

Most occupations have both males and females, but only males are Monegasque, Author, Gambler, or Journalist, and only females are Aristocracy or Spouse.

The network graph makes it especially visible that there are some slight inconsistencies in the data; at least one person has “Aristocracy” as an occupation, while others have “Aristocrat.” Cleaning and standardizing your data is key! That sounds like a job for…OpenRefine!

Timelines

All of the tools in Palladio have the same Timeline functionality. This basically allows you to filter the data used in your visualization by a date, whether that’s birthdate, date of death, publication date, or whatever timey wimey stuff you have in your dataset. Other types of data can be filtered using the Facet function, right next to the Timeline. Play around with filtering, and watch your visualization change.

Try Palladio today! If you need more direction, check out this step-by-step tutorial by Miriam Posner. The tutorial is a few years old so the interface has changed slightly, so don’t panic if the buttons look different!

Did you create something cool in Palladio? Post a comment below, or tell us about it on Twitter!


Lightning Review: Text Analysis with R for Students of Literature

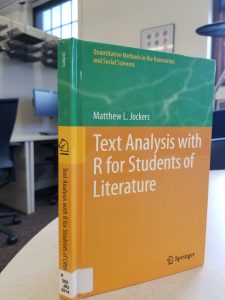
Cover of Text Analysis with R book

My undergraduate degree is in Classical Humanities and French, and like many humanities and liberal arts students, computers were mostly used for accessing Oxford Reference Online and double checking that “bonjour” meant “hello” before term papers were turned in. Actual critical analysis of literature came from my mind and my research, and nothing else. Recently, scholars in the humanities began seeing the potential of computational methods for their study, and coined these methods “digital humanities.” Computational text analysis provides insights that in many cases, aren’t possible for a human mind to complete. When was the last time you read 100 books to count occurrences of a certain word, or looked at thousands of documents to group their contents by topic? In Text Analysis with R for Students of Literature, Matthew Jockers presents programming concepts specifically how they relate to literature study, with plenty of help to make the most technophobic English student a digital humanist.

Jockers’ book caters to the beginning coder. You download practice text from his website that is already formatted to use in the tutorials presented, and he doesn’t dwell too much on pounding programming concepts into your head. I came into this text having already taken a course on Python, where we did edit text and complete exercises similar to the ones in this book, but even a complete beginner would find Jockers’ explanations perfect for diving into computational text analysis. There are some advanced statistical concepts presented which may turn those less mathematically inclined, but these are mentioned only as furthering understanding of what R does in the background, and can be left to the computer scientists. Practice-based and easy to get through, Text Analysis with R for Students of Literature serves its primary purpose of bringing the possibilities of programming to those used to traditional literature research methods.

Ready to start using a computer to study literature? This book is available both physically and digitally from the University Library.