Get more information about how we created and conducted the survey on the “About the Survey” page
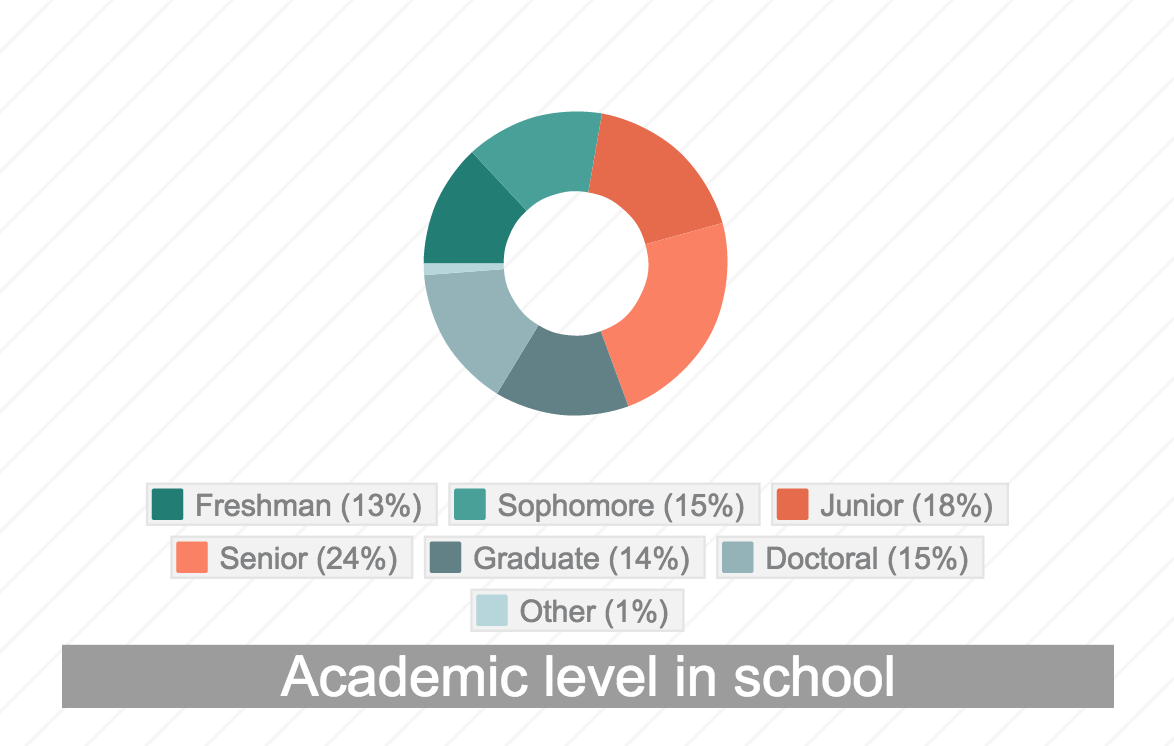
Two hundred and fifty two surveys were returned and a wide variety of majors and classes were represented across undergraduate, graduate and doctoral levels.
It was expressly stated in the survey that although all input is valued, but there are no implied promises that any particular features can be delivered.
The feedback was then categorized, quantified, and shared with members of the larger campus mobile steering group, including members of the campus Academic Mobility Advisory Group. Those results can be found in the “Survey Results Summary” below.
What students actually said…
Some of the best information came from the open-ended questions, which allowed students to answer in their own words. Check out their answers for “Top Ideas for what is missing on campus” and for “Additional Feature Requests that we didn’t include in our survey”
The Full Survey Results
If you are interested in seeing the full detailed survey results, check out the 524 Page PDF report.
Survey Results Summary

Question #1: Top improvement ideas
“What is your top idea or request to improve your mobile computing experience at UIUC? This is your chance to tell us exactly what you think is missing from your mobile experience”
Actual Answers:
View the students’ answers to this open-ended question
Common Themes:
| RANK | IMPROVEMENT REQUESTED | PCT |
| 1 | Wireless network strength, speed and access | 45% |
| 2 | An enterprise app for the UIUC campus | 10% |
| 3 | Make campus websites mobile-friendly | 7% |
| 4 | Make vendor apps mobile friendly (Blackboard, Moodle) | 7% |
| 5 | View grades and class schedule | 5% |
| 6 | View campus events calendar | 5% |
| 7 | View student account balances | 5% |
| 8 | View operating hours for facilities | 3% |
| 9 | Improve wireless printing capabilities | 3% |
| 10 | Provide better collaboration tools | 3% |
| 11 | Provide windows phone apps | 2% |
| 12 | Miscellaneous requests | 5% |
Question #2: Mobile feature ratings
“Please RATE how USEFUL each of these features would be on a smartphone, pad or tablet” (High, Medium or Low)
| RANK | FEATURE | PERCENTAGE RATED AS ‘HIGH’ |
| 1 | View class schedule | 78% |
| 2 | View grades/scores | 74% |
| 3 | Campus maps | 67% |
| 4 | Course content throughout semester | 62% |
| 5 | Register for a course | 62% |
| 6 | Build your schedule | 60% |
| 7 | View student account balances | 59% |
| 8 | Campus events schedule and info | 59% |
| 9 | Safety alerts and contacts | 58% |
| 10 | Advisor appointments | 54% |
| 11 | Drop a course | 51% |
| 12 | View academic history | 48% |
| 13 | DARS Audit / Major/Minor requirements | 44% |
| 14 | Collaboration tools | 42% |
| 15 | Instructor feedback | 40% |
| 16 | Help with projects, papers, research | 39% |
| 17 | Office hours | 38% |
| 18 | Library services | 35% |
| 19 | Computer lab and assistance tools | 32% |
| 20 | Technical Support | 28% |
| 21 | Employment help (Student work or career) | 27% |
Question #3: Additional feature suggestions
“Enter any additional features that we didn’t cover in the options above that you think would be useful on a smartphone, pad or tablet?
Actual Answers:
View the students’ answers to this open-ended question
Common Themes:
- Improve the wireless network’s reliability and access
- Integrate Google maps into all campus maps
- Provide an MTD app
- Consolidate most-used features into a single enterprise app
- Improve the mobile-friendliness of the campus email app
- Provide app that enables students to connect with others who’ve already taken a particular course
Question #4: Daily device usage
“Check the device(s) you use daily?
| DEVICE | PERCENTAGE |
| Smartphone | 94% |
| Laptop | 93% |
| Lab or desktop computer | 30% |
| Pad / Tablet | 29% |
Question #5: App platform preferences
“Which method would you prefer for accessing academic and campus information on a smartphone, pad or tablet?
| DEVICE | PERCENTAGE |
| Either option is fine with me, as long as I can find the information | 40% |
| I prefer a mobile app I can download from an app store | 38% |
| I prefer a mobile friendly website I can view from my device’s web browser (i.e. Safari, FireFox, Chrome, IE) | 18% |