
Phases of Hydrated Cement
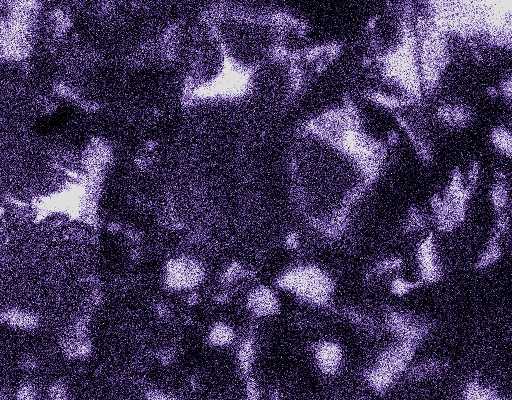
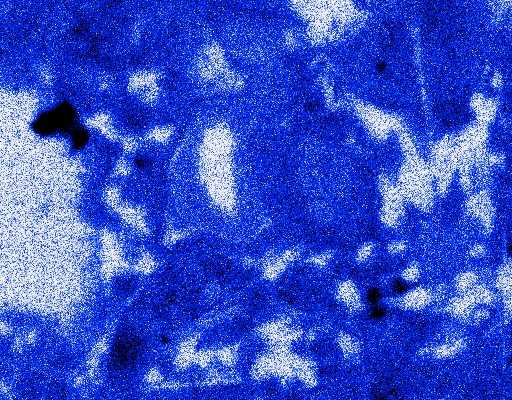
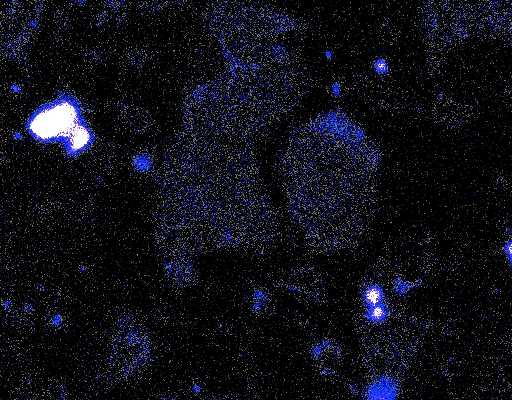
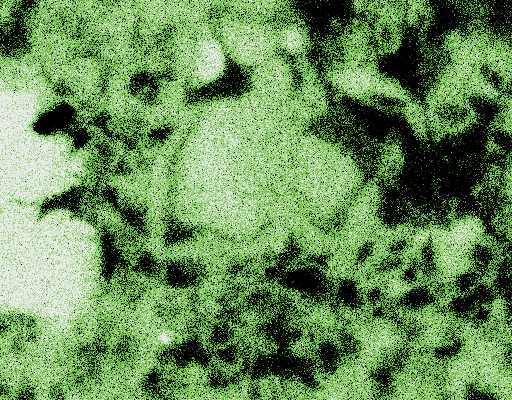
The hydration process converts unhydrated clinker grains into hydrated phases. These phases differ in morphology and can be differentiated by microscopy. The images below show how microscopy can be used to study hydration phases. The first image is a backscattered electron (BE) image of a polished section of hardened cement paste. The lightest regions are the unhydrated cores of cement grains. The set of x-ray dotmaps below show the relative abundance of six key elements in the structure. The brightest regions in the dotmaps are the highest concentration of the elements. Using knowledge of the BE image, the dotmaps, and cement hydration chemical reactions, one can learn a great deal about the distribution of phases in the microstructure.
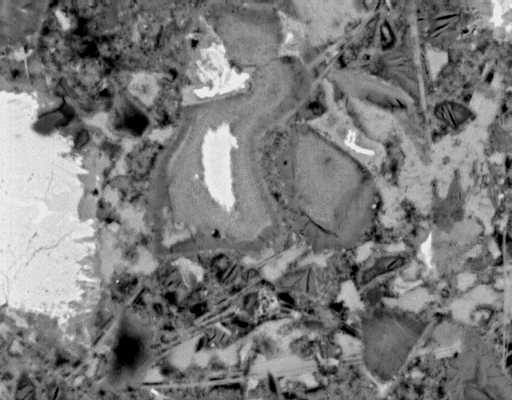
Backscattered electron image of polished section
X-ray dotmap image: Aluminum
X-ray dotmap image: Calcium
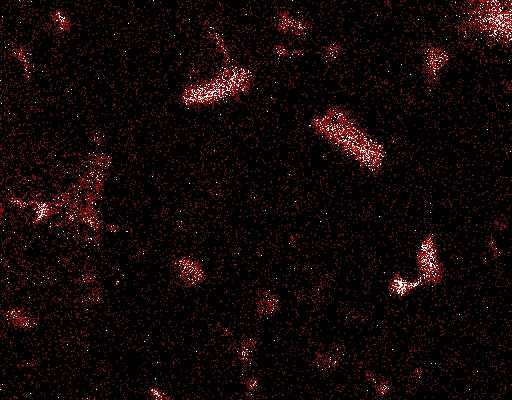
X-ray dotmap image: Iron
X-ray dotmap image: Magnesium
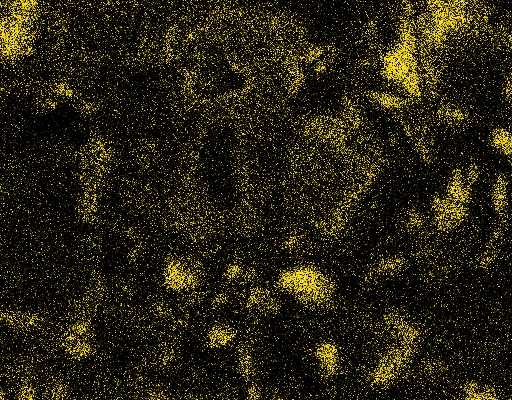
X-ray dotmap image: Sulfur
X-ray dotmap image: Silicon
[All BEI and dotmaps by Paul Stutzman, NIST]