
Fluorescent microscopy using thin sections
Optical microscopy using a fluorescent light source is often used to study distressed concrete samples. The technique is commonly used as a forensic tool to understand degradation, attack, and cracking of concrete. The technique usually involves the intrusion of a concrete sample with epoxy that is laced with a fluorescent dye. There are special techniques for intruding a concrete sample with epoxy that use long periods of time or pressure (negative or positive) to drive ultra-low viscosity epoxy into the pore structure of the sample.
The series of fluorescent optical micrographs shown below provide views of different levels of magnification. These images provide insight into alkali-silica reaction and corrosion. The fluorescent optical micrographs shown here are provided courtesy of Karl Petersen and his advisor Prof. Tom VanDam at Michigan Technological University.
Contact information (current as of Fall 1999):
Karl Peterson
Transportation Materials Research Center
Department of Civil and Environmental Engineering
Michigan Technological University
1400 Townsend Drive
Houghton, MI 49931
http://www.civil.mtu.edu/~krpeters/
krpeters@mtu.edu
906-487-2423 (lab phone)
314 Dillman Hall (laboratory)
301A Dillman Hall (office)
The following micrographs were recorded from a fluorescent epoxy impregnated thin section prepared from a concrete pavement. The micrographs illustrate rusted steel, alkali-silica reactive chert sand, and secondary ettringite growth in air voids.
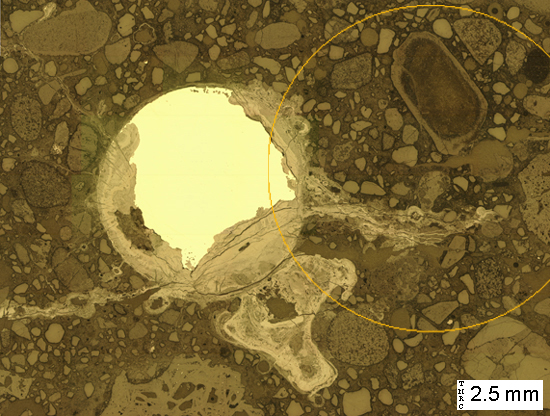
(Micrograph 1) Reflected light image of a cross-section through rusted wire mesh. The unoxidized steel reflects brightly. The rust reflects less brightly than the steel, but reflects more brightly than the aggregates and cement paste.
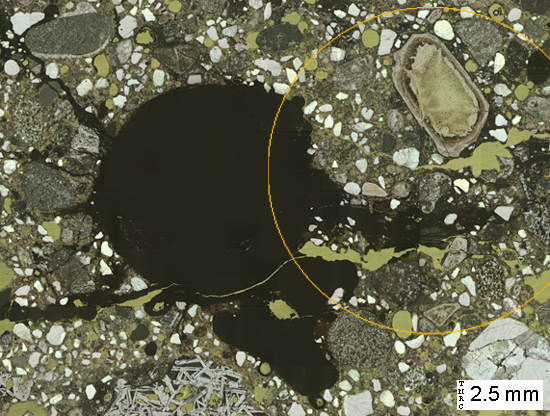
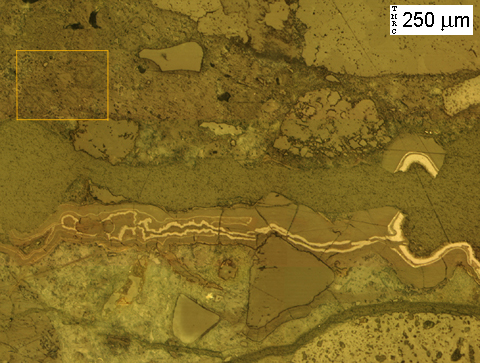
(Micrograph 2) Same view as in (1), as seen with transmitted light. The steel wire mesh and the rust are opaque to transmitted light. The aggregates are generally transparent to transmitted light. Along the bottom of the image, towards the left side, is an unusual coarse aggregate made up of tabular crystals. The coarse aggregate used in this pavement was blast furnace slag.
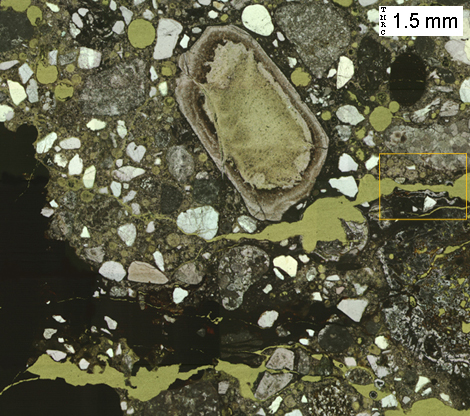
(Micrograph 3) Close-up of circular region outlined in (1) & (2). The chert sand particle in the upper-middle portion of the image has undergone an alkali-silica reaction. Voids and cracks near the chert aggregate are lined with alkali-silica gel.
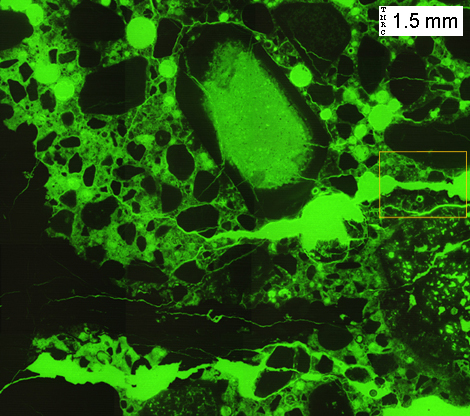
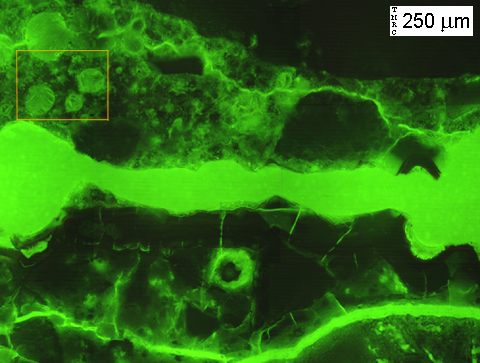
(Micrograph 4) Same view as in (3), as seen with reflected blue light and a yellow blocking-filter. The use of blue and yellow filters causes the fluorescent-dyed epoxy to appear bright green. The fluorescent dye allows for easier observation of cracks, voids, and porosity. The alkali-silica reactive chert aggregate is more porous in the interior, and more dense where in contact with the cement paste.
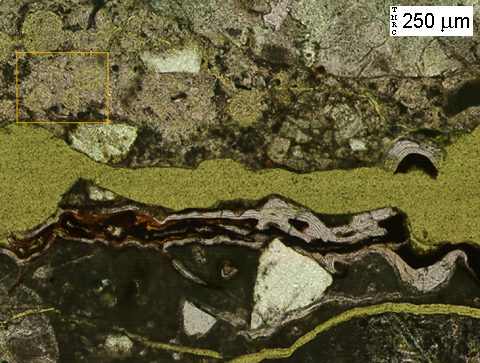
(Micrograph 5) Close-up of rectangular region outlined in (3) & (4). Alternating layers of alkali-silica gel and rust line the large crack which runs horizontally through the middle of the image.
(Micrograph 6) Same view as in. The rust layers stand out brightly under reflected light. From the patterns recorded in this alkali-silica gel deposit, it appears that the crack was initially lined with gel, then subsequently coated with rust. This cycle appears to have occurred repeatedly as the crack grew to its current width.
(Micrograph 7) Same view as in (5) and (6). The cracks which run sub-horizontally across the image are easily visible thanks to the fluorescent dye. Dessication cracks in the gel deposits are also visible. Dessication cracks occur due to drying of the sample, which is a necessary step during preparation, unless you employ the sample preparation strategies outlined in: L. Struble and P.E. Stutzman, “Epoxy impregnation of hardened cement for microstructural characterization”, Journal of Materials Science Letters, vol. 8, pp. 632-634, 1989.
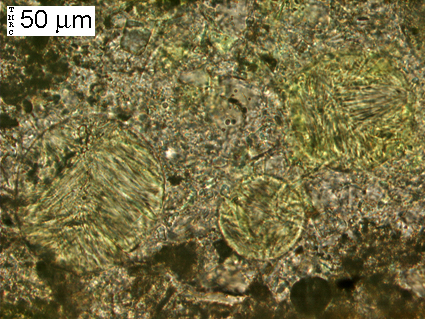
(Micrograph 8) Close-up of rectangular region outlined in (5), (6) & (7). The fibrous mineral seen filling the three entrained air voids is ettringite.
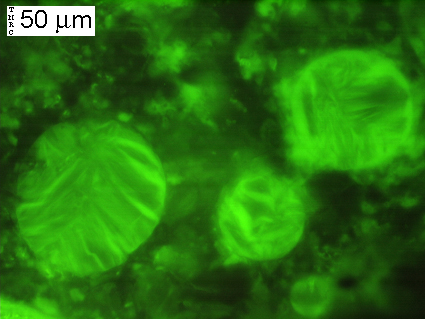
(Micrograph 9) Same view as in (8). The three entrained air voids glow green, but it is clear that secondary ettringite deposits have almost completely filled the voids.
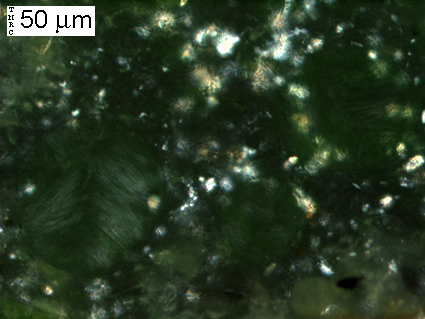
(Micrograph 10) Same view as in (8) & (9), as seen with transmitted light using crossed-polars. Anisotropic materials appear bright when placed between crossed-polars. Isotropic materials appear dark when placed between crossed-polars. The bright spots in the cement paste are probably portlandite crystals. The ettringite fibers, though difficult to see, are slightly visible with crossed-polars, since ettringite posseses an anisotropic crystal structure.