It’s that time of year where everyone starts to enjoy all things spooky and scary – haunted houses, pumpkin picking, scary movies and…data visualizations! To celebrate Halloween, we have created a couple of data visualizations from a bunch of data sets. We hope you enjoy them!
Halloween Costumes
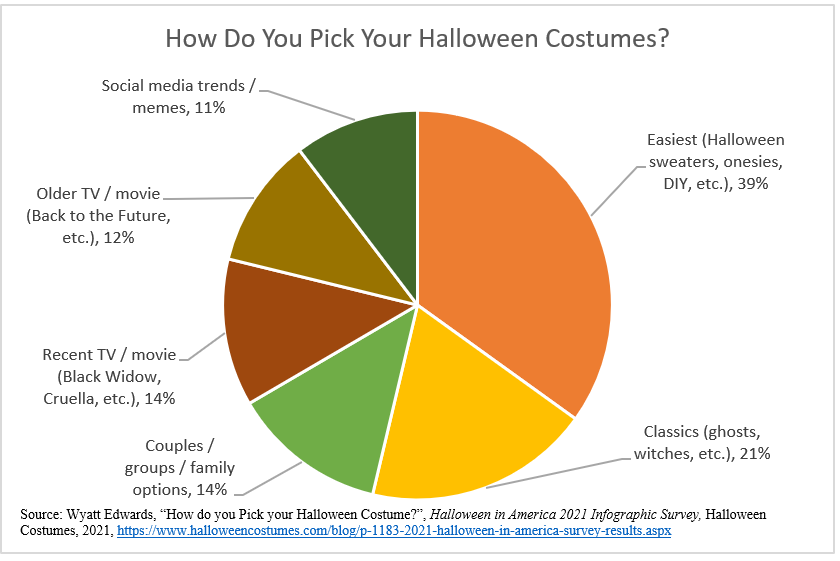
How do you decide what Halloween costume you wear? Halloween Costumes conducted a survey on this very topic. According to their data, the top way people choose their costume is based on what is easiest to make. Other inspirations include classic costumes, coordination with others, social media trends, and characters from either recent or classic movie or tv franchises.
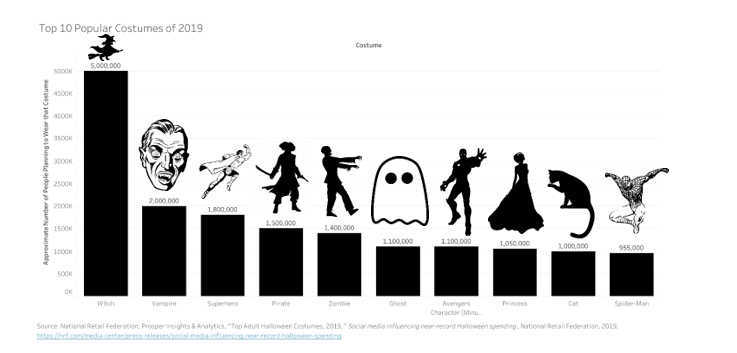
The National Retail Federation also conducted a survey of the top costumes that adults were expected to wear in 2019 (there were no good data sets for 2020…). According to the survey, the most popular Halloween costume that year was a witch. Other classic costumes, such as vampires, zombies, and ghosts, ranked high too. Superheroes were also a popular costume choice, with many people dressing up as Spider-man or another Avengers character.
Halloween Spending and Production
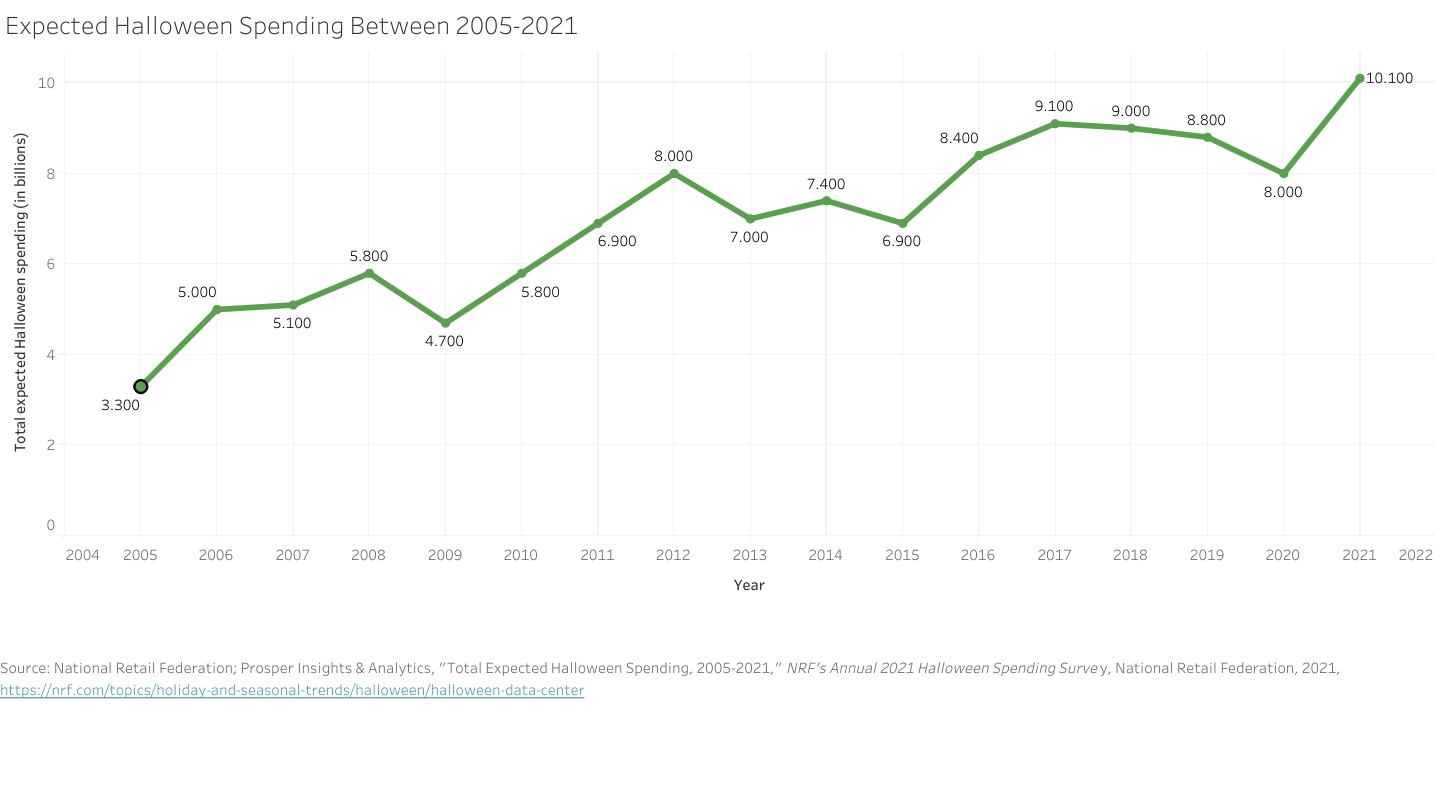
According to the National Retail Federation, Halloween spending has significantly increased between 2005 to this year, with the expected spending this year surpassing 10 billion dollars! That is up from fifteen years ago when the estimated Halloween spending averaged around 5 billion dollars.
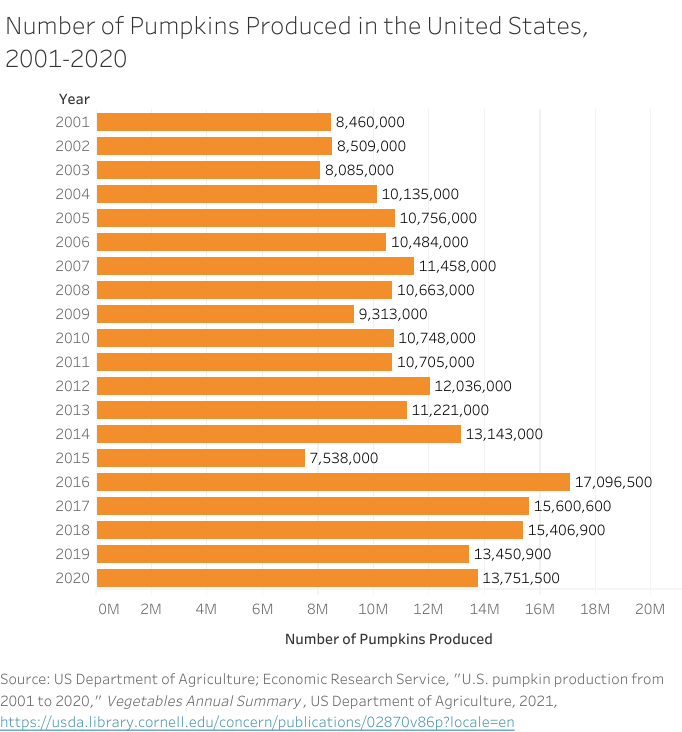
With much spending invested in Halloween, it would make sense that the production of Halloween-related items would likely grow too to meet this demand. The U.S. Department of Agriculture records each year the number of pumpkins produced in the United States. Besides one dip taken in 2015, it appears that pumpkin production has almost doubled in the past twenty years on average.
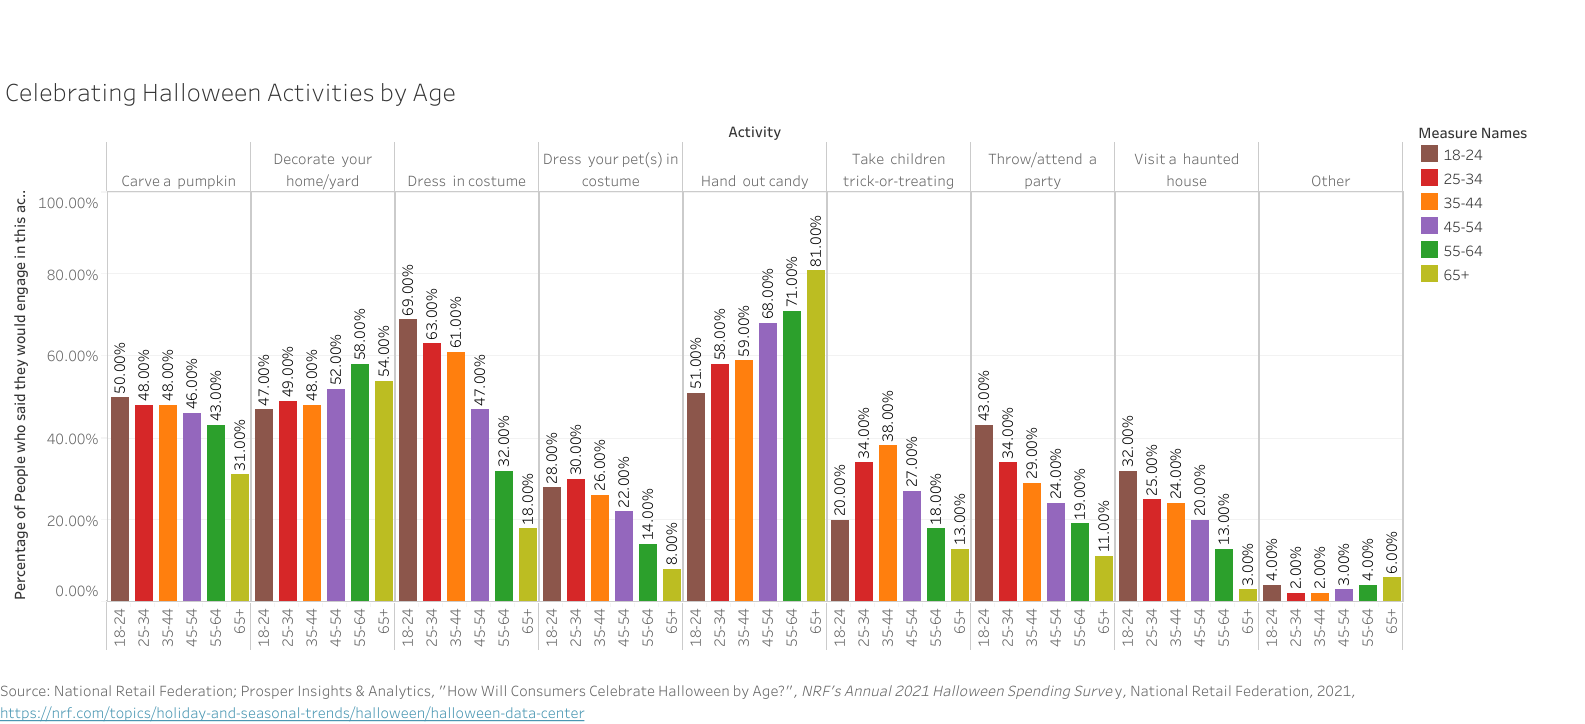
Halloween Activities by Demographics
Finally, here are two statistics taken from the National Retail Federation again regarding how people celebrate activities based on age and region. As the data shows, younger people seem more likely to dress in costumes, visit haunted houses, or throw parties on Halloween. Meanwhile, older individuals are more likely to decorate their homes or hand out candy.
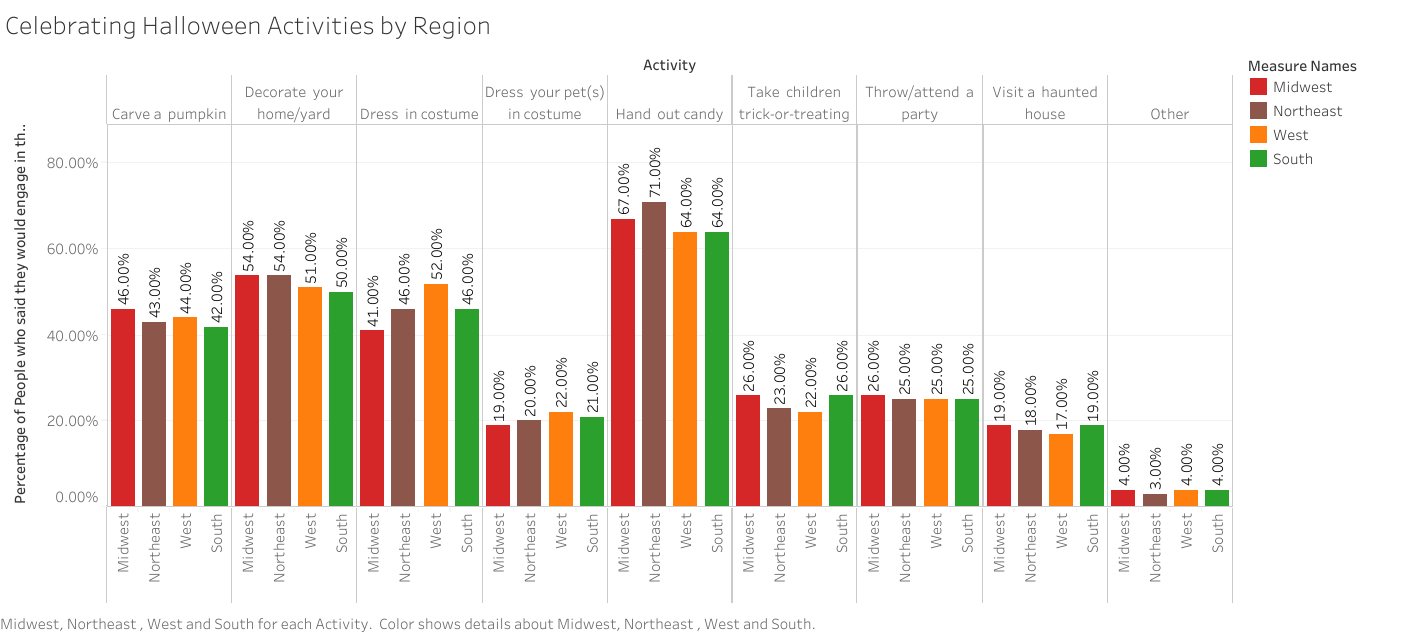
At the same time, there seems to be not too huge of a difference in celebrating by region, apart from those living on the west coast being more likely to dress up or those living in the northeast more likely to hand out candy. Other than those two differences, it seems that most regions celebrate the same Halloween activities in the same proportions.
We hope these data visualizations got you in the mood for spooky, Halloween fun! From all of us at the Scholarly Commons, Happy Halloween!