Data Storytelling with Scholarly Commons

What is Data Storytelling? 

Oftentimes data is presented in a manner that is dry or incomprehensible to a general audience. Data storytelling is a more interactive and compelling way to present information. Data storytelling is defined as using visualizations to tell a narrative that communicates insights about data to a wider audience.  
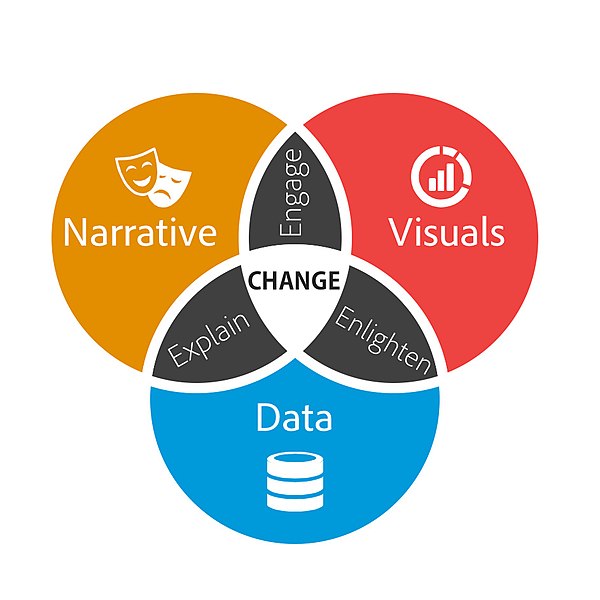
Venn diagram with three circles which are narrative, visuals and data. Where visuals and narrative overlap says engage. Where visuals and data overlap says enlighten. Where narrative and data overlap says explain. In the intersection of all three circles says change.  
Brent Dykes, CC BY-SA 2.5, via Wikimedia Commons 
 

When writing a data story, start by collecting your data. Look for the most interesting trends and determine the main points you want to get across in your data story. A data story should have a complete narrative rather than being a series of barely connected data visualizations. Make sure the story you are telling is appropriate for your audience.  

Resources for Creating a Data Story: 

The Scholarly Commons Collection is located in the UIUC Main Stacks. Books in this collection are available to check out. The collection includes books that provide introductory information to data storytelling. 

  1. Effective data storytelling : how to drive change with data, narrative and visuals 

This resource is available to UIUC faculty, staff, and students online. It focuses especially on the narrative aspects of data storytelling rather than the visualization aspect. This book explains the psychology of why storytelling is such an effective communication tool.  

  1. Storytelling with data : a data visualization guide for business professionals 

This resource is only available as a physical book. Data storytelling is a method often used by business professionals to impart information in a more meaningful and persuasive way. This book speaks specifically to business professionals and explains how to consider context, determine the appropriate format for the story, and speak to an audience in a compelling way.  

  1. Storytelling with data : let’s practice! 

This book is also available online with an active illinois.edu email address. It provides over 100 hands-on exercises to help you to gain practice in choosing effective visuals, keeping your visualizations clean, and telling a story.  

Scholarly Commons also provides access to various software that can be accessed on the computers in Main Library room 220. These tools can also be accessed through UIUC Anyware. Useful software for data storytelling includes: 

  1. Tableau Public

Tableau is a popular data visualization tool with many features useful for making many types of visualizations, such as histograms, pie charts, and boxplots. Tableau also allows users to create dashboards which create a comprehensive story by combining visuals and data.  

 Dashboard created in Tableau
Marissa-anna, CC BY-SA 4.0, via Wikimedia Commons 

  1. ArcGIS 

ArcGIS software allows you to create maps and add data to them. This tool would be especially useful if your data is geographically focused. ArcGIS StoryMaps is an additional tool that allows you to create a story using images, texts, maps, lists, videos and other forms of media.  

Map of Covid cases created in ArcGIS

Dennis Sylvester Hurd, CC-BY 2.0, via Flickr 

If you have data you need to share with an audience, consider sharing it through a data story. Data stories are often more visually appealing and engaging than other methods of sharing data. The Scholarly Commons has lots of useful tools to help you create a data story! 

Facebook Twitter Delicious Email

Visualizing your love for data

This post is in celebration of the love data week between Feb-13-Feb 17, 2023. 

Analytics screen graph.
Photo by Luke Chesser on Unsplash 

What is Data visualization?  

For this author, it was love at first sight. Well, technically, it was love at first Visualization. So many say seeing is believing, and data visualization helps us accomplish that, especially at the rate at which data is increasing exponentially in our world. The truth is that data is everywhere, and for us to draw meaning from it, we need to present it in a clear and concise manner.  

Data visualization is the graphical representation of data. Data can be represented in various forms and shapes, such as maps, charts, infographics, graphs, heat maps, or sparklines. When data is presented through visual elements, it is easy to understand and analyze. It helps you to derive meaning from the data and make better decisions. Visualizing your data involves using certain tools; these tools help you fall more in love with data.  

Data Visualization tools are software that allow you to create graphical representations of your data.  

Here are some tools to help you get started. These have been selected based on their ease of use, features (such as capacity for large volumes of data), cost, and popularity.

  1. Data Wrapper: If you are just starting out with data Visualization and you are looking for a free tool to help you get started, Data wrapper is your plug. Data Wrapper is a beginner-friendly tool with a clean and intuitive user interface accessible online. It is straightforward to navigate and great for creating charts and maps that can be easily embedded into reports. It also allows you to upload your files in various formats such as CSV, .tsv, and .txt 

Pros: 

  • Great for beginners.
  • Free to use.
  • Accessible online tool.

Cons:  

  • It can be challenging to build complex charts. 
  • Limited features. 
  • Security is not guaranteed as it is an online tool.
  1. Infogram: If you are not super design-inclined, this visualization tool should be your best friend. It has an editor drag-and-drop feature that makes it super easy to create beautiful designs without having to worry about where you are with your design skills. Infographics, marketing reports, maps, social media posts, and many more are examples of what you can create with this powerful tool. In addition, your data output can be exported in various formats, such as. JPG, GIF, PNG, HTML, and . PDF.  

Pros:

  • Web-based. 
  • Drag-and-drop editor.
  • Easy to use.
  • Highly customizable.

Cons: 

  • Built-in data sources are limited.
  • Not suitable for complex visualization.
  1. Google charts: Google Charts is another free data visualization tool that is user-friendly and compatible with all browsers and platforms. If you like to play around with codes, then Google Charts provides you with that option. Google Charts are coded with SVG and HTML5, allowing it to produce several graphic and pictorial data visualizations, ranging from simple visualization such as pie charts, bars, charts, histograms, maps, and scatter graphs to more complex ones such as hierarchical tree maps, timelines, and gauges. Google fusion tables, spreadsheets, and SQL databases are examples of data sources that can be used with Google Charts.  

Pros:

  • It is free.
  • It is compatible with various browsers.
  • Compatible with google products.

Cons:

  • Technical support is limited.
  • It requires network connectivity for visualization. 
  • There is no room for customization. 
  1. Tableau: This is one of the most popular data visualization tools, mainly because of the free public version that this software provides. Tableau provides the option of a desktop app, server, and online versions. In addition, this software has several data importation options, such as CSV files for google ads. Similarly, if you are looking into presenting your data in various formats, such as multiple chart formats and mapping, then Tableau is the one for you.  

Pros:

  • Provides several options for data import. 
  • It is available for free (public version).

Cons:

  • Lack of Privacy in the public version. 
  • Paid versions are costly. 

5. Dundas BI: Although this is one of the oldest data visualization tools, it is still standing strong as one of the most powerful tools for visualizing data with interactive charts, tree maps, gauges, smart tables, and scorecards. This interactivity allows users to understand the data quickly. Dundas BI is also highly customizable. Dundas BI operates on the ground of responsive HTML5 web technology that allows users to connect, analyze and interact with their data on any device. This powerful tool also provides a built-in feature for extracting data from many data sources.  

Pros:

  • Highly flexible.
  • Provides a variety of visualization options.

Cons: 

  • It lacks predictive analysis. 
  • Does not support 3D charts.  

There you have it! Now you know the tools to ask out on a date when you are ready to visualize your data. As much as you love data, these tools can help make others fall in love with your data, too.   

Facebook Twitter Delicious Email

Of Maps and Memes: A Bit of Cartographic Fun

Co-Authored by Zhaneille Green

We use maps to communicate all the time. Historically, they have been used to navigate the world and to stand as visual, physical manifestations of defined spaces and places. What do you think of when we say “map”: a topographic map1 a transportation map2 or a city map3?

You can use maps to represent just about anything you want to say, far beyond these typical examples. We wrote this blog to invite you to have a little cartographic fun of your own.

If you’re on any kind of social media, you’ve probably seen maps like the one below, highlighting anything from each state’s favorite kind of candy to what the continental US would look like if all of the states’ borders were drawn along rivers and mountain ranges. People definitely seem to enjoy sharing these maps, curious to see what grocery store most people shop at in their home state, or laughing about California’s lack of popularity with the states in the surrounding area.

Map of most popular halloween candy in each US state. View the interactive version on candystore.com

Try your hand at creating your own silly map by using our programs in the Scholarly Commons. Start a war by creating a map that ranks the Southern states with the best barbecue using Adobe Photoshop or Illustrator, or explore a personal hobby like creating a map of all the creatures Sam & Dean Winchester met through the 15 seasons of Supernatural using ArcGIS.

If you’re feeling a bit more serious, don’t fret! Even if these meme-like maps aren’t portraying the most critical information, they do demonstrate how maps can be a great tool for data visualization. In many ways, location can make data feel more personal, because we all have personal connections to place. Admit it: the first thing you checked on the favorite candy map was your home state. Maps also tend to be more visually engaging than a simple table with, for example, states in one column and favorite animal in the other.

Using geotagging data, each dot represents where a photo was taken: blue for locals, red for tourists, and yellow for unknown. Locals and Tourists #1 (GTWA #2): London. Erica Fischer, CC BY-SA 2.0 via Flickr.

Regardless of what you want to map, the Scholarly Commons has the tools to help bring your vision to life. Learn about software access on our website, and check out these LinkedIn Learning resources for an introduction to ArcGIS Online or Photoshop, which are available with University of Illinois login credentials. If you need more assistance, feel free to ask us questions. Go forth and meme!

Facebook Twitter Delicious Email

Spaces Highlight: Interview in a Self-Use Media Booth

Media booth interior

Getting an interview is both exciting and nerve-wracking. While I was excited for the opportunity, I knew I would have to deal with the stressors involved with interviewing on Zoom: what to say, what to wear, and where to do the interview. I wanted a place where I could be sure I would not be interrupted, would not have to deal with loud noises, and that would look professional to the interviewers. I decided to take advantage of my workplace’s resources and try out the self-use media studios in Scholarly Commons. I made my appointment on the Scholarly Commons website

The self-use media studios are sound isolation booths with features including two Shure MV7 microphones, Insta360 4k Webcam, LED light banks, three large screens, mac studio, headphones, powered speakers, and Stream Deck. The studios are designed for video recording, podcasting, oral histories, streaming, interviews, video editing, and more. 

I checked into the booth thirty minutes before the start of my interview. The signs posted around the booth told me how to log in, control the audio, and adjust the camera to follow my movements. I experienced a small challenge, when I could not figure out how to get the camera to turn on. But, with the help of Scholarly Commons staff I was able to begin my interview on time and confident in both myself and the technology I was using. 

One of the first things the interviewers asked me was where I was zooming in from. They were extremely impressed with the set up and the professional setting helped me to stand out as a candidate. I felt comfortable speaking at a regular volume, trusting that those outside could not hear what I was saying as I could not hear anything from outside of the booth. The audio was clear on both my side and the interviewers’. 

If you are using the media studios for the first time, you might find these tips helpful: 

  1. Book in advance- the booths are first-come, first-serve and can fill up quickly
  2. Make your booking earlier than your meeting so that you have time to set up and be prepared in case of any challenges
  3. Make sure to read all the signage as they have instructions, helpful tips, and images which help make the booths easier to navigate
  4. If you are having difficulty, ask a staff member as they are happy to help

I found the self-use media studios in Scholarly Commons to be an excellent place to do my interview. If you have an interview coming up or a project that would benefit from the use of an audio booth, I would highly recommend booking one of the media studios. 

Facebook Twitter Delicious Email

Copyright Enforcement Tools as Censorship

This week, Scholarly Commons graduate assistants Zhaneille Green and Ryan Yoakum, alongside Copyright Librarian Sara Benson, appeared as guest writers for the International Federation of Library Associations and Institutions’ blog as part of a series for Copyright Week. Their blog post looks at how the current copyright tools on platforms such as YouTube and Facebook allow large corporate or governmental entities to silence and suppress individual voices. You can read the full blog post on the IFLA blog website.

Facebook Twitter Delicious Email