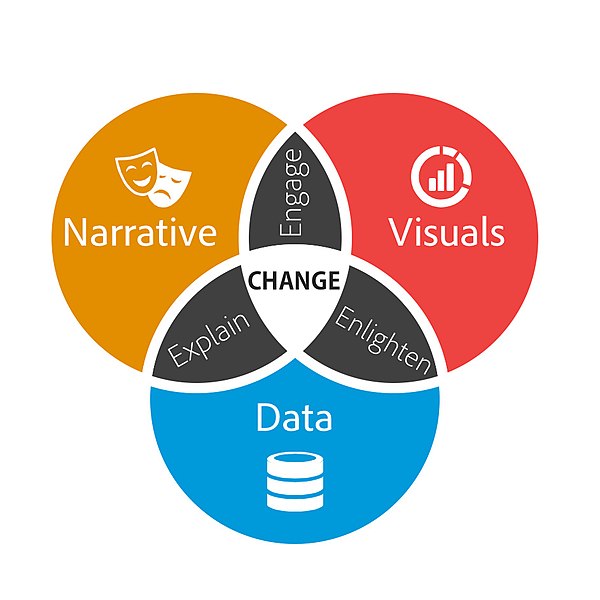
What is Data Storytelling?
Oftentimes data is presented in a manner that is dry or incomprehensible to a general audience. Data storytelling is a more interactive and compelling way to present information. Data storytelling is defined as using visualizations to tell a narrative that communicates insights about data to a wider audience.

Brent Dykes, CC BY-SA 2.5, via Wikimedia Commons
When writing a data story, start by collecting your data. Look for the most interesting trends and determine the main points you want to get across in your data story. A data story should have a complete narrative rather than being a series of barely connected data visualizations. Make sure the story you are telling is appropriate for your audience.
Resources for Creating a Data Story:
The Scholarly Commons Collection is located in the UIUC Main Stacks. Books in this collection are available to check out. The collection includes books that provide introductory information to data storytelling.
This resource is available to UIUC faculty, staff, and students online. It focuses especially on the narrative aspects of data storytelling rather than the visualization aspect. This book explains the psychology of why storytelling is such an effective communication tool.
This resource is only available as a physical book. Data storytelling is a method often used by business professionals to impart information in a more meaningful and persuasive way. This book speaks specifically to business professionals and explains how to consider context, determine the appropriate format for the story, and speak to an audience in a compelling way.
This book is also available online with an active illinois.edu email address. It provides over 100 hands-on exercises to help you to gain practice in choosing effective visuals, keeping your visualizations clean, and telling a story.
Scholarly Commons also provides access to various software that can be accessed on the computers in Main Library room 220. These tools can also be accessed through UIUC Anyware. Useful software for data storytelling includes:
- Tableau Public
Tableau is a popular data visualization tool with many features useful for making many types of visualizations, such as histograms, pie charts, and boxplots. Tableau also allows users to create dashboards which create a comprehensive story by combining visuals and data.

Marissa-anna, CC BY-SA 4.0, via Wikimedia Commons
- ArcGIS
ArcGIS software allows you to create maps and add data to them. This tool would be especially useful if your data is geographically focused. ArcGIS StoryMaps is an additional tool that allows you to create a story using images, texts, maps, lists, videos and other forms of media.

Dennis Sylvester Hurd, CC-BY 2.0, via Flickr
If you have data you need to share with an audience, consider sharing it through a data story. Data stories are often more visually appealing and engaging than other methods of sharing data. The Scholarly Commons has lots of useful tools to help you create a data story!

