The Earth beneath our feet is a prodigious source of neutrinos. These geoneutrinos are the result of decays of radioactive nuclei in the Earth’s interior, and have now been detected! If a future experiment can measure the arrival direction of geoneutrinos, it will allow us to take a picture of the Earth’s radioactive interior! Citation: Fields & Hochmuth (2006)
The Earth contains a certain amount of natural radioactivity, and the decay of these radioactivities is an important and perhaps dominant source of geothermal heat. These same decays also generate particles known as neutrinos. In measuring the arrival directions of neutrinos generated in the decay of natural radioactive elements in the Earth’s interior, it will be possible to get a three-dimensional picture of the Earth’s composition and shell structure. This will provide a new and detailed understanding of the origin of the Earth’s geothermal heat, and will finally answer the question of how much heat comes from radioactive decays, and how much is “primordial” heat leftover from the birth of the Earth. The mapping of the Earth’s interior might also help give answers to such questions as “What powers the magnetic field of the Earth?” and “What dominates the geodynamo?”.
To actually take a neutrino picture of the Earth is quite challenging technically, but not impossible. Neutrinos are subatomic particles created in certain types of nuclear decays. These ghostly particles have no electric charge, a tiny but nonzero mass, and are very weakly interacting. A typical neutrino passes through matter unseen, unfelt, and unperturbed. Indeed, each second of the day and night, many billions of neutrinos pass through you harmlessly; these neutrinos originate mostly from the Sun, but also from the Earth’s atmosphere, and from the interior of the Earth. These last “geoneutrinos” have received a great deal of attention lately, and open up new views onto the Earth.
Geoneutrinos are produced in the decays of unstable, radioactive elements–mostly uranium, thorium, and potassium (40K)–inside the Earth. These same decays also generate heat, which makes up some portion (thought to be about 60%) of the geothermal heat flow.
Fields & Hochmuth (2006) calculated the pattern of arrival directions
(i.e., the angular distribution) of the geoneutrinos. Simply put, we simulated the image of the Earth as seen by an observer with “neutrino eyes.” To so this, we used geophysical models of the Earth’s interior (the Mantovani, Carmignani, Fiorentini & Lissia model for the crust-mantle system and the predictions of the laboratory experiments for the core) to create several models of the Earth’s interior and its radioactive content. In all models, radioactive elements are highly concentrated in the outer crust of the Earth; the differences come in whether or not the core contains any radioactivity.
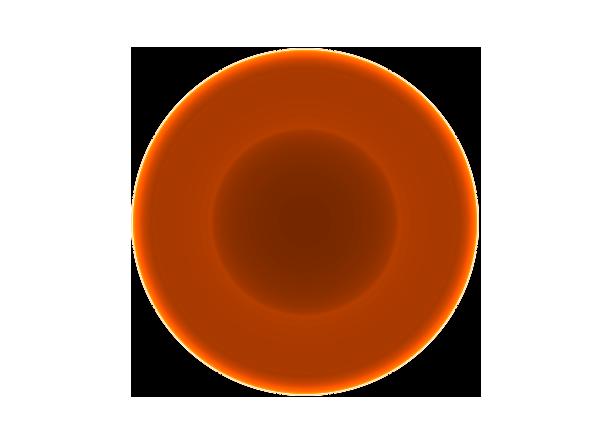
The image at left shows one of our simulations of the neutrino views of the Earth. Imagine donning “neutrino goggles” and looking down; these images show what one would see. However, the Earth takes up half of the “sky” (i.e., the ground) and thus occupies a full hemisphere of your field of view. To represent a curved hemisphere on a flat image requires some projection effects (similar to those needed in representing the whole globe of the Earth on a flat map). In this image, the center is what you would see looking straight down–these are the neutrinos which come up through your feet! The outer edge of the disk represents the view towards the horizon, so that as you scan from the center to the edge of the image, imagine going from a downwards to a horizontal view. We see that the largest signal is right near the horizon–this is due to the high concentration of radioactive species in the Earth’s crust. These neutrinos do not come through your feet, but rather arrive almost horizontally–hitting you in the forehead!
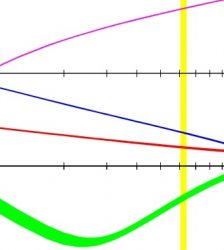
A geoneutrino image allows us to image Earth’s radioactive interior and discover where the radioactivity lies. The two images at left illustrate how this would.

The two pictures of the Earth show the extreme cases for the nature of the Earth’s core. In the upper picture the center (core) is almost dark, as no radioactive material was included. The bottom picture has a bright center. Here the maximum amount of potassium given in the laboratory experiments (7000ppm) was added to the upper picture. Notice the large contribution of the crust in both cases! We find that even with a crude angular resolution of only 30 degrees a neutrino detector is able to distinguish between the models and to determine how much potassium is in the core. That is, even a very blurry neutrino view of the Earth can answer the question “is there a bright spot underfoot?”.